
A benefits QBR exists to answer one question: is your healthcare spend tracking with what your vendors promised, and if not, who's fixing it? Run it as a tight 60 to 90 minute meeting with a single objective: leave with a documented decision on renewal posture, plan design, or vendor accountability, not a stack of slides nobody reads twice.
Here's the time breakdown that works for most mid-sized employer teams:
- 5 minutes, intro and objective — facilitator (usually the benefits manager) states the decision the meeting needs to reach.
- 15 minutes, executive summary — HR lead presents the top three takeaways in plain financial terms.
- 25 minutes, underwriting and claims review — broker or TPA walks through claims trend, Rx spend, and the renewal number against market benchmarks.
- 20 minutes, vendor and broker Q&A — HR runs the "Should Have Answers" checklist, live.
- 10 minutes, decisions and next steps — CFO or finance rep confirms budget impact, action tracker gets assigned owners.
Attach these to the calendar invite at least three days ahead: the prior quarter's claims summary, the current Rx utilization report, and any large-claim roll-forward data. Without pre-reads, you'll burn half the meeting explaining numbers instead of deciding what to do about them.
Pro Tip: Send the executive summary slide (just one slide) 48 hours before the meeting. Attendees who skim it beforehand ask sharper questions and the Q&A block actually gets used for accountability instead of orientation.
Key Takeaways
A Benefits QBR agenda works when it forces a documented decision within 90 minutes, backed by claims data, vendor accountability, and an owner-assigned action tracker.
| Point | Details |
|---|---|
| Run a 90 minute decision meeting | Structure the agenda around one required outcome: accept renewal, change plan design, or open an RFP. |
| Bring seven core metrics | Focus on claims trend, Rx and specialty spend, high-cost claimants, and engagement rates only. |
| Use the benchmark band | Compare your renewal against the 6.5% to 9% market range before accepting a number. |
| Convert vague answers into written requests | Any PBM refusal to disclose spread pricing should trigger a formal, dated follow-up. |
| Track vendor performance with Hadaco | Use quarterly reporting and a transparent savings estimator to hold population health programs accountable each quarter. |
Table of Contents
- Building Out the Detailed Benefits QBR Agenda Item by Item
- What Data Should You Bring to a Benefits QBR?
- Which Questions Should HR Bring to Brokers and Vendors?
- Who Should Attend and How Should You Present the Data?
- How Do You Evaluate Vendor ROI Credibly?
- Spotting Hidden PBM and Contract Costs
- What Should Every Slide in the QBR Deck Show?
- Closing the Loop: The Action Tracker
- Why HR Has to Own the Benefits QBR
- How Hadaco Fits Into Your Quarterly Benefits Review
- Frequently Asked Questions
- Sources
Building Out the Detailed Benefits QBR Agenda Item by Item
The one-pager tells you when things happen. This section tells you what to actually say and ask during each block, because a vague "review claims trend" line item is how QBRs turn into status updates instead of decision points.
- Opening (5 min). State the objective out loud: "Today we decide whether to accept the renewal as presented, pursue plan design option B, or move to RFP." Naming the decision up front keeps the room from drifting into anecdotes.
- Underwriting and claims review (25 min). Ask the broker directly: "What's driving this specific trend number, not the industry average?" Push for a claims driver waterfall, not a single renewal percentage.
- Vendor Q&A (20 min). Run through the broker question checklist covering PBM spread, specialty drug counts, and GLP-1 utilization. If an answer is vague, note it as an action item on the spot rather than letting it slide.
- Decisions and next steps (10 min). Confirm the decision against your three preset criteria: accept renewal, approve a specific plan design change, or trigger an RFP process. Assign an owner and a date to every open item before anyone leaves the room.
Pro Tip: Ask your broker to run two renewal scenarios in advance, one with the plan design change you're considering and one without. Reviewing modeled numbers live cuts the post-meeting back-and-forth roughly in half because the finance question gets answered on the spot instead of in a follow-up email three weeks later.
What Data Should You Bring to a Benefits QBR?
Bring seven numbers, not seventy. Claims trend, Rx spend and specialty utilization, high-cost claimant counts, utilization by service line, cost per employee, engagement and participation rates, and absenteeism or leave impacts. Everything else is supporting detail that belongs in an appendix, not the main deck.
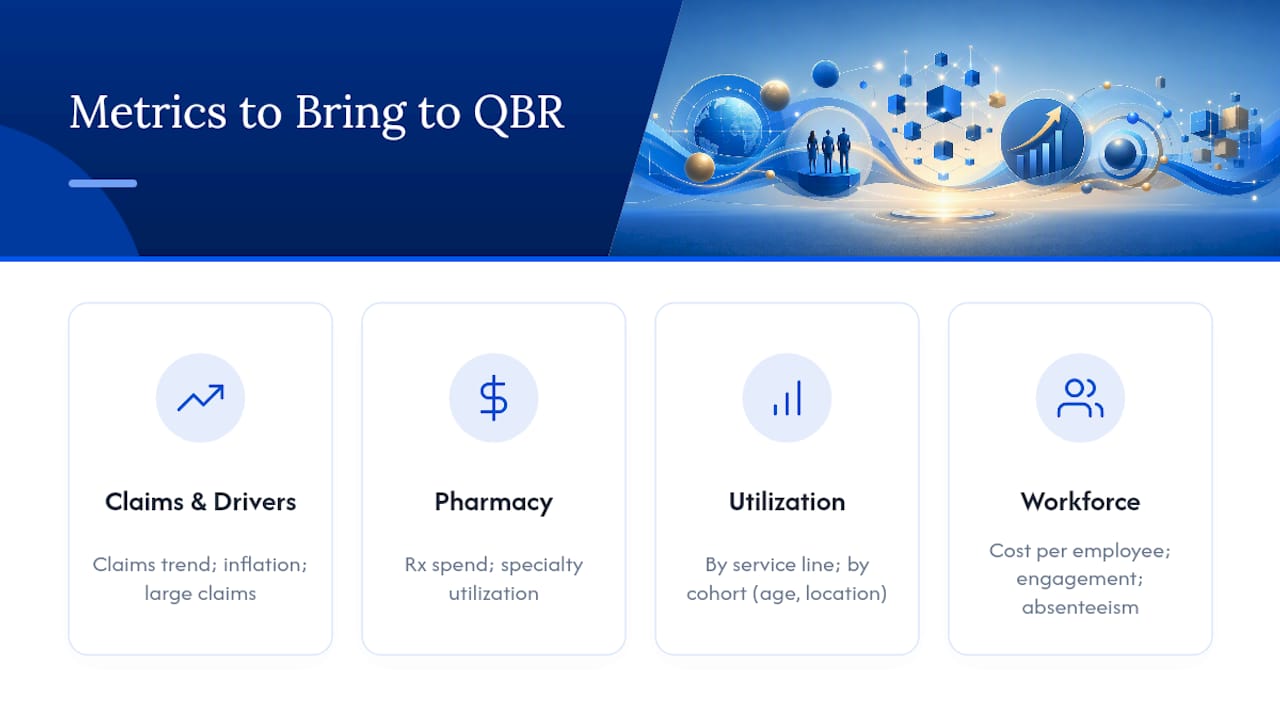
Match the visual to the question you're answering. A trend line works for claims trajectory over eight quarters. A waterfall chart is the only honest way to show what's actually driving a renewal increase, since it separates inflation, utilization, and large claims instead of burying them in one number. A scatter plot of high-cost claimants against plan type reveals concentration risk a summary table hides completely. Utilization broken out by cohort (age band, location, department) shows whether a spike is company-wide or isolated.
Market renewal trend guidance for 2026 sits between 6.5% and 9% for most employer groups. If your broker presents a renewal above that range without a clear driver explanation tied to your own claims data, that's your cue to ask harder questions before accepting the number. "Trend vs. market" simply means comparing your own year-over-year cost growth against that benchmark band, not against last year's renewal alone.
Which Questions Should HR Bring to Brokers and Vendors?
SHRM's guidance on benefits reviews is blunt: HR leaders should ask targeted questions about controllable cost drivers rather than accepting a broker's summary at face value. That means arriving with a written list, not a mental one.
- "What's the exact PBM spread on our specialty drug spend this quarter?"
- "How many GLP-1 prescriptions did we have, and what's the year-over-year utilization trend?"
- "Can you show us the large-claim roll-forward, not just this quarter's new claims?"
- "What specific factors are driving our renewal number above or below the market range?"
- "What's the rebate pass-through percentage, and when do we actually receive it?"
If a vendor refuses to share spread pricing, gives a rolling average instead of quarter-specific numbers, or can't produce cohort-level utilization detail, treat that as a red flag requiring escalation, not a normal information gap. Convert every unclear answer into a written follow-up request with a name and a due date attached before the meeting ends.
Pro Tip: Phrase the ask as "we need this in writing by [date] for our records," not "can you clarify." Vendors respond faster to a documented request than an open-ended question because it signals you're tracking the answer.
Who Should Attend and How Should You Present the Data?
Invite the HR lead, a CFO or finance representative, the broker, the TPA, the PBM representative, relevant vendor leads, and a designated facilitator who isn't also presenting. Six to eight people is the ceiling; beyond that, the room stops making decisions and starts performing for an audience.
- 90 days out: request the prior quarter's full claims and underwriting data.
- 60 days out: confirm which vendors are attending and finalize the agenda.
- 30 days out: assemble the draft deck and circulate for internal review.
- 7 days out: send the final packet, including the one-page executive summary and key charts.
The packet itself should include a two-line executive summary, no more than four key charts, and the vendor Q&A checklist attached as a working document. A 90 day runway is typical for most employer groups, with 120 days recommended if you're considering a carrier change or a level-funded plan structure.
When presenting, open with your top three takeaways before anyone sees a single detailed chart. Prefer visuals to raw tables wherever possible, and close every section with a specific recommendation rather than leaving the room to interpret the data themselves.
How Do You Evaluate Vendor ROI Credibly?
Most vendor ROI claims fall apart under one question: what's the baseline, and over what window was this measured? A credible evaluation methodology requires four things before you accept a savings claim.
- Define the baseline using claims data from before the program launched, not an industry average.
- Set an attribution window of at least 12 months, since health outcomes and claims impacts rarely show up in a single quarter.
- Require measurable KPIs tied to actual claims reduction, engagement participation, or documented utilization shifts, not satisfaction scores alone.
- Demand comparable evidence, meaning cohort-level claims detail and, where possible, a comparison against a similar population that didn't participate.
Weight hard financial savings more heavily than soft outcomes in your scorecard, but don't discard engagement and productivity metrics entirely; they're often the leading indicator that predicts next year's claims trend before it shows up in a renewal number. Our own guidance on wellness program ROI walks through a fuller version of this scorecard approach.
| Evidence Type | Weight | What "Good" Looks Like |
|---|---|---|
| Claims reduction (documented) | High | Pre/post comparison with 12+ month window |
| Engagement participation | Medium | Sustained, not launch-quarter spike |
| Utilization shift | Medium | Cohort-level detail, not aggregate |
| Self-reported satisfaction | Low | Supplementary only, never standalone proof |
Spotting Hidden PBM and Contract Costs
Pharmacy contracts hide more cost than any other line item in a benefits program, and most of it sits in language HR never reads closely. Demand spread pricing disclosure, rebate pass-through terms in writing, audit rights in the contract itself, clear rebate timing, and visibility into any DIR or residual clawback fees.
- Watch for rolling averages presented instead of quarter-specific NDC-level detail.
- Aggregated specialty data that hides individual high-cost drug cases is a common evasion tactic.
- Missing cohort-level reporting on GLP-1 and specialty utilization should trigger a formal written request, not a verbal follow-up.
- If a PBM resists an audit clause outright, that alone is grounds to open an RFP conversation.
Pro Tip: Bring finance or legal into the conversation the moment a vendor refuses to put rebate terms in writing. That's not a negotiation stalling point HR should absorb alone.
What Should Every Slide in the QBR Deck Show?
Keep the deck to roughly twelve slides. Anything longer turns into a document nobody finishes reading before the meeting starts.
- Executive summary (three takeaways, financial framing)
- Quarter in review (headline numbers only)
- Claims trend and drivers (waterfall chart)
- Pharmacy deep dive (Rx spend, GLP-1, specialty)
- Vendor program performance (ROI scorecard)
- High-cost claimant spotlight (anonymized, cohort-level)
- Utilization by service line
- Engagement and participation trends
- Risk and compliance flags
- Benchmark comparison (trend vs. market)
- Recommendations and decision points
- Next quarter priorities
Each slide needs a named data owner responsible for accuracy, and detailed backup tables belong in an appendix, not the main deck. Store the master version in a shared, version-controlled location so each quarter builds on the last one instead of starting from scratch, an approach structured QBR templates are built specifically to support.
Closing the Loop: The Action Tracker
A QBR without an action tracker is just a meeting that happened. Build the tracker with six columns: action, owner, due date, acceptance criteria, status, and escalation path.
| Column | Purpose |
|---|---|
| Action | The specific task or decision to execute |
| Owner | One named person, never a team |
| Due date | Hard deadline, tied to the next QBR cycle |
| Acceptance criteria | What "done" looks like, in measurable terms |
| Escalation path | Who gets notified if the item stalls past 30 days |
- Escalate any item untouched after 30 days to the CFO or executive sponsor automatically.
- Flag any cost driver that moves more than two points above forecast for immediate mid-cycle review.
- Run a lightweight 90-day check to confirm vendors delivered what they promised, not just what they reported.
- Fold every open item directly into your renewal prep timeline so nothing gets rediscovered in month eleven.
Why HR Has to Own the Benefits QBR
The single biggest failure pattern I see in benefits reviews isn't bad data. It's HR treating the broker's slide deck as the agenda instead of building their own. When HR shows up with a prewritten list of questions on PBM spread, GLP-1 utilization, and claims drivers, the entire tone of the meeting shifts from a broker presenting to HR to HR directing the conversation.

That shift matters more than any single metric on the page. A CHRO who runs a sharp, decision-focused QBR is demonstrating something CFOs and boards increasingly expect: that HR treats benefits spend with the same rigor as any other line item on the P&L, not as a fixed cost nobody questions until renewal season forces the issue.
The practical move is simple. Stop letting brokers set the agenda and stop accepting a renewal percentage without a driver breakdown behind it. Ask for the underwriting story every single quarter, not just at renewal. Vendors respond to consistent scrutiny, and the employers who get the best long-term outcomes are the ones whose brokers know the hard questions are coming before they walk into the room.
How Hadaco Fits Into Your Quarterly Benefits Review
Most of the friction in a Benefits QBR comes from vendors who report late, report vaguely, or can't tie their numbers to a dollar figure your CFO will accept. Hadaco was built to remove exactly that friction. Its population health programs plug into your existing plan without disruption, and the platform delivers the quarterly reporting your QBR agenda actually needs: claims impact, engagement participation, and a transparent savings estimator that shows projected and realized savings side by side.
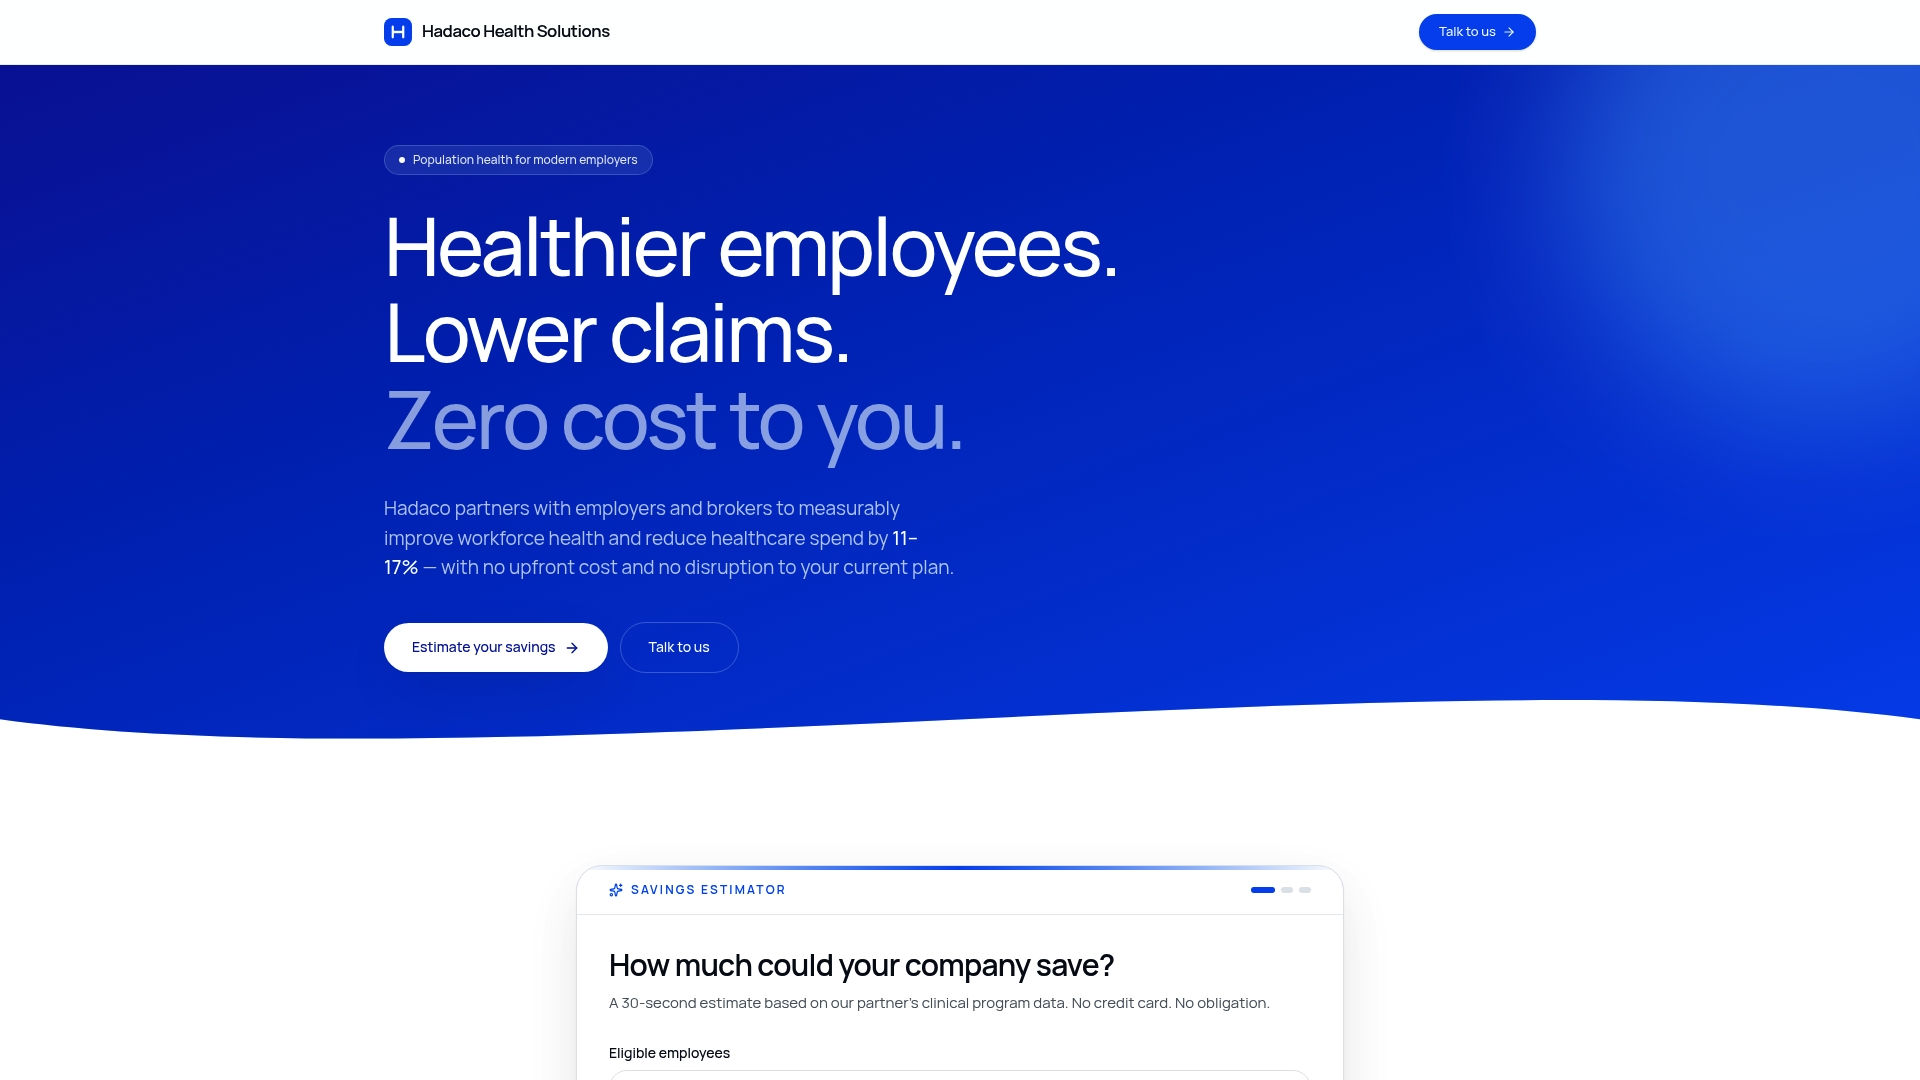
Employers working with Hadaco often see average first-year savings of $451 per employee, backed by quarterly outcome reports built specifically for meetings like the one you just planned. There are no upfront fees, so the program's own performance is what earns its place on your agenda quarter after quarter. If your current vendor reporting can't survive the questions in this article, book a consultation with Hadaco and see what a QBR-ready savings estimate actually looks like.
Frequently Asked Questions
What is the ideal length for a Benefits QBR meeting? Sixty to ninety minutes is usually enough if the agenda is decision-focused rather than a general status update. Longer meetings tend to drift into anecdotes instead of action items.
How often should employers hold a Benefits QBR? Quarterly is standard, with an additional mid-year check between June and July to catch utilization or communication gaps before renewal season begins.
Ask for a driver-level breakdown before accepting the number. A renewal above that market range without a clear explanation tied to your own claims data is a signal to push back, not a number to accept as final.
Who should facilitate the Benefits QBR? Ideally someone from HR who isn't also presenting vendor data, so they can keep the meeting focused on the required decision instead of getting pulled into presenting.
What's the biggest mistake HR makes in a Benefits QBR? Letting the broker's slide deck become the agenda. Coming prepared with your own question list is what turns a status update into an accountability meeting.
Sources
- Your benefits broker should have answers. Do they? — SHRM webinar
- Mid-Year Benefits Review: What to Adjust Before Open Enrollment — Post Insurance (2026)
Attach your finished QBR agenda and slide deck as reusable templates in your HR shared drive, so each quarter starts from the last one instead of a blank page.