
Healthcare spend analytics is the practice of analyzing your company's medical and pharmacy claims data to find exactly what's driving costs and which fixes will actually move the number. Done right, it replaces vague renewal dread with a prioritized list of interventions and real negotiating leverage with your carrier.
The payoff is specific, not theoretical. Employers who dig into claims at the transaction level typically find their top 5% of claimants driving 50% or more of total plan spend, and that single fact usually reorganizes an entire cost strategy. A few things you'll be working with immediately:
- PMPM (per member per month): the core normalizing metric that lets you compare cost trends across years even as headcount shifts.
- Medical loss ratio (MLR): useful, but it can mask category-level problems that PMPM decomposition catches.
- Stop-loss thresholds: where your high-cost claimant data intersects with reinsurance strategy.
The verdict: analytics done well before renewal season turns a passive cost review into an active savings plan, often with measurable per-employee impact within the first plan year.
Key Takeaways
Healthcare spend analytics works when claims data is normalized to PMPM, segmented by real cost drivers, and turned into targeted interventions measured quarter over quarter against a defined baseline.
| Point | Details |
|---|---|
| Get transactional data | Insist on claim-line detail, not carrier summaries, to catch errors and contract leakage. |
| Watch the top 5% | High-cost claimants often drive a significant portion of total plan spend, so start there. |
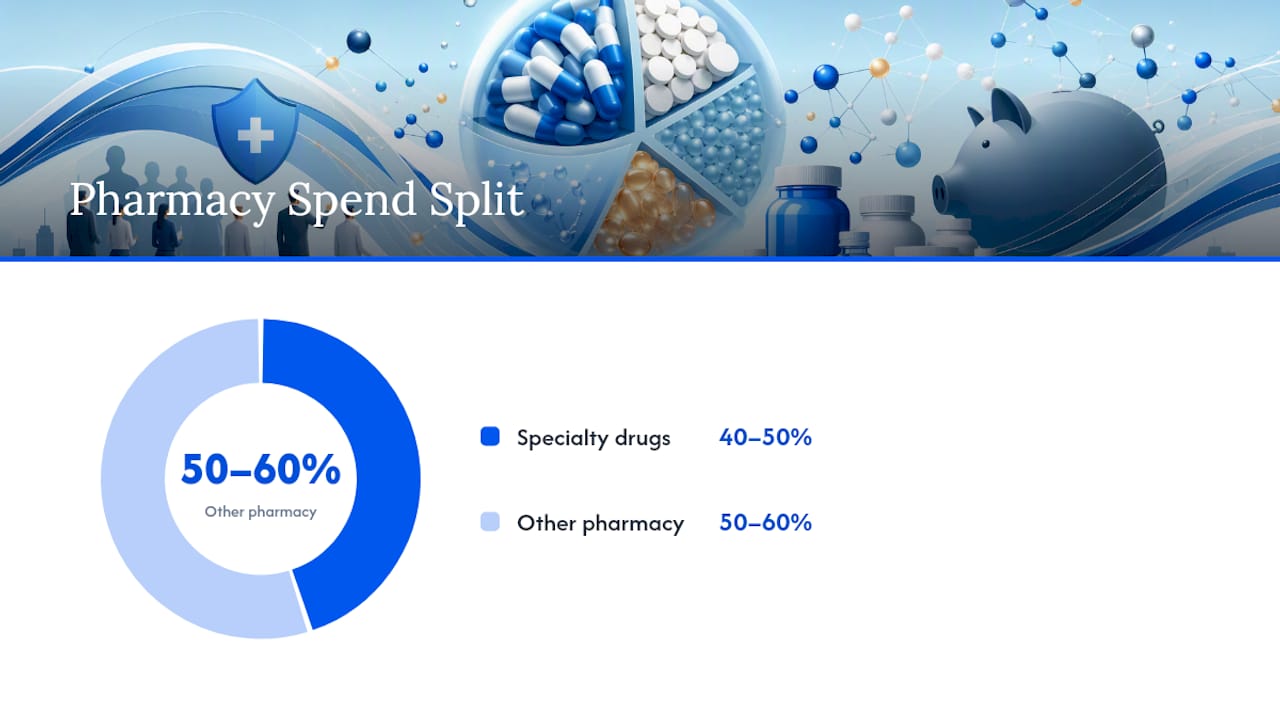
| Track pharmacy separately | Specialty drugs can be 40%–50% of pharmacy spend despite low prescription volume. |
| Start 90 days early | Late analysis leaves no room to model changes before renewal negotiations. |
| Consider a partner | Hadaco integrates with existing plans and reports average first-year savings of $451 per employee with quarterly verification. |
Table of Contents
- What Data and KPIs Actually Drive Healthcare Spend Analytics
- How to Analyze Claims Data to Find Real Savings
- Common Pitfalls in Healthcare Claims Analytics
- Build In-House or Bring in a Vendor?
- A 7-Step Action Checklist for Turning Data Into Savings
- How Hadaco Turns Claims Data Into Measurable Savings
- Sources
What Data and KPIs Actually Drive Healthcare Spend Analytics
You can't analyze what you don't have. Start by requesting these sources from your carrier, TPA, or PBM: medical claims (transactional, not summarized), pharmacy claims, enrollment and eligibility files, premium statements, stop-loss reports, PBM rebate and formulary detail, and, where available, HSA/FSA and absence data. Provider and facility identifiers matter too. They're what let you trace a cost spike back to a specific network or site of care.
A quick checklist of fields to insist on: claim line detail, paid amount, allowed amount, provider taxonomy code, NDC/drug code, place of service, diagnosis groupings, and member months. Without member months, you can't calculate PMPM at all, and PMPM is the single most useful normalizing metric for spotting real trend versus enrollment noise.
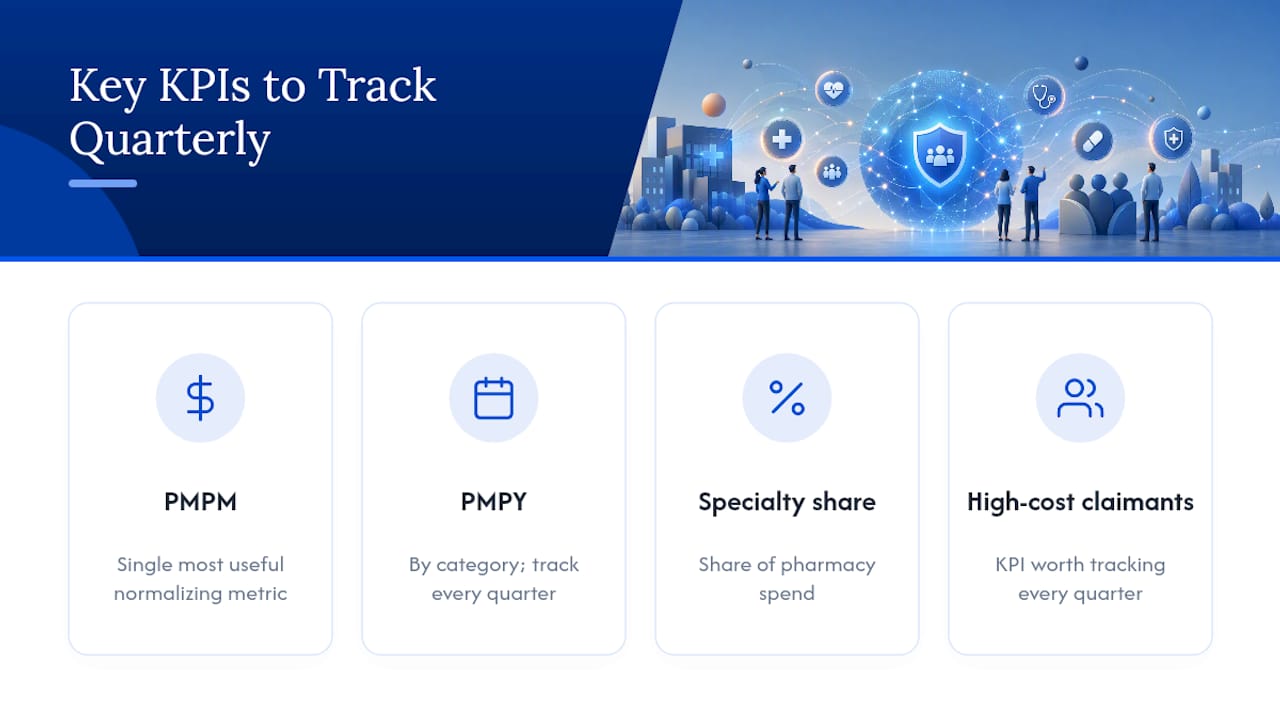
Once you have the data, these are the KPIs worth tracking every quarter: PMPM and PMPY by category, MLR, high-cost claimant concentration, generic dispensing rate (GDR), specialty drug share of pharmacy spend, inpatient admission rate, and out-of-network percentage.
Those service-category ranges are your tripwires. Notable deviations from typical pharmacy spend indicate areas to investigate.
How to Analyze Claims Data to Find Real Savings
Raw claims data is noise until you run it through a few specific methods. Normalize everything to PMPM first, then segment by cohort (age band, location, job class) and by condition category. Layer in year-over-year trend decomposition to separate true cost growth from mix shift or one-time claimants. Then isolate your high-cost claimant tier and run a root-cause pass on pharmacy, specifically the specialty drug category.
That sequence matters because specialty drugs frequently make up 40% to 50% of pharmacy spend while representing a small share of actual prescriptions. A plan with a healthy GDR can still incur high costs due to a small number of specialty claimants.
Some use cases return ROI faster than others. Watch for:
- ER-to-urgent-care substitution opportunities when emergency spend runs above typical benchmark levels.
- Specialty pharmacy management when a handful of members account for a disproportionate drug spend line.
- Network or contracting leakage, often invisible until you audit transactions instead of trusting summaries.
- Missed contract discounts, which show up only when someone checks paid amounts against contracted rates line by line.
Three short examples show the pattern. A 900-employee manufacturer noticed ER visits running well above benchmark; a claims deep dive showed after-hours urgent care wasn't covered at parity, so employees defaulted to the ER, highlighting the importance of workplace benefits through our GP in managing access-driven ER use. Fixing the copay structure closed most of the gap within two quarters. A logistics company found its pharmacy PMPM climbing steadily despite a strong GDR. The cause was three specialty claimants on high-cost biologics with no site-of-care management. And a regional retailer's claims audit turned up a pattern of out-of-network billing at a single facility that had been miscoded as in-network for over a year.
Pro Tip: Carrier dashboards summarize by design, which means they can smooth over the exact repeatable errors that cost the most. Request line-level transactional claims at least once a year and have someone audit them, not just the aggregated report.
Common Pitfalls in Healthcare Claims Analytics
The most expensive mistake is treating the carrier's annual summary as the whole picture. Summary reports meet reporting requirements, but they routinely obscure structural problems like ER overuse or contract nonadherence that only show up at the transaction level.
A few other patterns show up again and again:
- Late timing. Waiting until 30 days before renewal leaves no room to model changes or negotiate. Build a 90 to 120 day pre-renewal calendar instead.
- Attribution errors. Blaming a benefit design change for a cost spike without controlling for demographic shifts or a single high-cost claimant skews the whole analysis.
- Program sprawl. Launching five wellness initiatives at once because the data was "interesting" everywhere, instead of picking the one or two structural issues with the clearest ROI path.
- Attempted re-identification. Trying to match de-identified claims data back to specific employees, even informally, creates real compliance exposure.
Independent claims audits that review 100% of transactions, not a sample, consistently surface recurring process and contract issues that aggregated carrier reports miss entirely, from miscoded claims to unapplied contract discounts.
Set clear governance before you start: a named data steward, HIPAA-compliant data handling agreements with any vendor touching claims files, and a defined access policy so analysis stays at the population level, never the individual.
Build In-House or Bring in a Vendor?
The honest answer depends on what capabilities you already have. In-house analytics works when you have someone who can handle data ingestion, condition grouping, and PBM detail reconciliation on top of their existing job. Most mid-market employers don't, which is why a vendor partnership usually wins on speed and depth, especially for predictive modeling and specialty drug root-cause work.
If you're evaluating a vendor, run through this checklist:
- Data access. Can they ingest transactional claims, not just summaries, from your carrier and PBM?
- Security and compliance. Do they have documented HIPAA safeguards and a clear data handling policy?
- Audit capability. Can they review 100% of claims transactions rather than sampling?
- Methodology transparency. Will they show you exactly how they attribute savings to specific interventions?
- Proof of outcomes. Do they have client references with measurable, verified results?
Timing matters as much as capability. Start 60 to 90 days before renewal at minimum, and push for the most detailed data your carrier or TPA will provide. Self-funded plans generally have a right to de-identified member-level detail. Governance should include a benefits lead, someone from finance, your broker or TPA contact, and a data steward who owns file quality.
On the numbers: quarterly reviews plus one full pre-renewal deep dive is the cadence that keeps most employers ahead of surprises. Savings expectations vary by plan size and starting condition mix, but the standard is tracking PMPM impact and dollars per employee, verified quarter over quarter rather than estimated once and left alone.
A 7-Step Action Checklist for Turning Data Into Savings
- Request transactional claims data, not summaries, from your carrier, TPA, and PBM.
- Normalize and segment by PMPM, cohort, and condition category to find real outliers.
- Run high-claimant and pharmacy deep dives to isolate the two or three structural drivers worth acting on.
- Define one or two pilot interventions with a clear target, such as raising GDR toward the 88%–92% benchmark or reducing ER visits by a set percentage.
- Negotiate with vendors or your network on the specific issue the data surfaced, whether that's a formulary gap or a contract discrepancy.
- Communicate the change to employees in plain terms tied to their benefits, not just a cost-cutting memo.
- Measure pre/post PMPM with a defined attribution method, then decide whether to scale, adjust, or fold the pilot into renewal terms.
A successful pilot has one thing in common every time: a target set before the pilot started, not a number invented afterward to make the results look good.
What Actually Moves the Needle
The employers who see real results almost always focus on one or two concentrated cost drivers, usually a handful of high-cost chronic conditions, rather than spreading effort across a dozen small initiatives. If you do one thing after reading this, pull your top-claimant report before your next renewal call.
How Hadaco Turns Claims Data Into Measurable Savings
If your team doesn't have the bandwidth to run this analysis in-house, Hadaco builds population health programs specifically around the structural cost drivers described above, chronic disease, preventive care gaps, and low engagement, without touching your existing plan design. There's no upfront fee, and every engagement runs on a transparent savings estimator so you know the target before you commit.
What sets the approach apart is accountability you can actually check: claims-level transparency, quarterly reporting, and outcomes verified against a defined baseline rather than a one-time projection. Employers working with Hadaco see an average of $451 saved per employee in the first year, alongside better engagement and retention, because the programs address the actual claims data rather than guessing at wellness perks employees won't use. If you're weighing a build versus buy decision after your own claims review, or if you want a second set of eyes on the interventions your data points to, a Hadaco program on top of your existing wellness efforts covered in how wellness programs reduce healthcare costs is worth the conversation. Book a demo through Hadaco's savings assessment and get a specific estimate before your next renewal cycle.
Sources
- How to Read Your Group Health Plan's Claims Data
- How Employers Use Claims Audits to Reduce Healthcare Costs
- How to Read a Claims Report: A Guide for Benefits Admins
- How to turn your claims data into smarter benefits decisions | Nava Benefits