
TL;DR:
- Employer healthcare costs in 2026 are driven mainly by specialty drugs, catastrophic claims, and behavioral health increases. To contain trend, employers should audit pharmacy spending, implement targeted plan design changes, and enhance vendor accountability. Building evidence-based prevention programs and care navigation infrastructure offers long-term cost reduction and access improvement.
Employer healthcare costs are rising faster in 2026 than at any point in the past decade, and the primary culprits are specialty drugs, catastrophic claims, and a utilization shift that is quietly pushing employees back into emergency rooms. UnitedHealthcare projects a medical trend increase for 2026, accompanied by rising pharmacy costs and an increase in catastrophic claims (those exceeding $100,000). The Business Group on Health puts the employer-projected median trend at roughly 9%, dropping to approximately 7.6% when plan design changes are applied. Two immediate implications: first, budget for a medical trend near the high single digits before any mitigation; second, your single highest-leverage move right now is auditing your pharmacy benefit manager contract and specialty drug spend, because specialty medications now account for a majority of total pharmacy spend for many employer plans.
Table of Contents
- What are the top employer healthcare trends shaping 2026?
- What is actually driving employer health care costs in 2026?
- What should employers do to contain costs and protect access?
- How should you budget and forecast for 2026?
- What can AI and digital health realistically deliver in 2026?
- How do you measure impact and hold vendors accountable?
- Your 60–90 day action checklist for HR and benefits leaders
- A population health program that reduced claims: what the evidence shows
- Key Takeaways
- The case for bolder moves in 2026
- Hadaco helps employers get ahead of 2026 cost pressures
- Primary sources and further reading
What are the top employer healthcare trends shaping 2026?
The forces driving costs in 2026 are not random. They cluster around a handful of predictable, measurable trends that HR and benefits leaders can act on directly.
-
Specialty pharmacy and GLP-1 obesity drugs. Pharmacy costs are projected to rise significantly year over year, with GLP-1 medications for obesity and oncology therapies leading the charge. Specialty meds now represent roughly 55% of pharmacy benefit spend for many plans.
-
Catastrophic and high-cost claimants. Claims above $100,000 have demonstrated notable increases in UnitedHealthcare's book of business. A single catastrophic case can distort an entire plan year's trend.
-
Mental and behavioral health utilization. Behavioral health claims have seen substantial increases from 2023 to 2024 and have continued climbing. Access gaps and workforce stress are both contributors.
-
Return to in-person care and ER creep. Virtual care utilization decreased in 2025 while ER utilization saw a modest rise. That shift is expensive, and it is not reversing on its own.
-
AI and digital navigation adoption. Employers are piloting multi-agent AI tools for care navigation, prior-authorization automation, and site-of-care steering. The near-term payoff is in routing, not diagnosis.
-
Value-based care expansion. Employers are demanding outcome-tied contracts from vendors and health systems. Accountability language in vendor agreements is becoming standard, not optional.
-
Workforce demographics and early-onset chronic disease. Chronic conditions remain the top cost driver. Business Group on Health notes that an aging workforce and worsening population health are increasing condition-management needs, making evidence-based prevention a financial necessity.
-
PBM scrutiny and alternative contracting. Employers are moving away from rebate-heavy PBM models toward transparent, pass-through arrangements. Mercer and Business Group on Health both flag this as a 2026 priority.
What is actually driving employer health care costs in 2026?
The headline trend percentages are useful for budget conversations, but the mechanics behind them tell you where to intervene.
Specialty pharmacy: the dominant cost engine
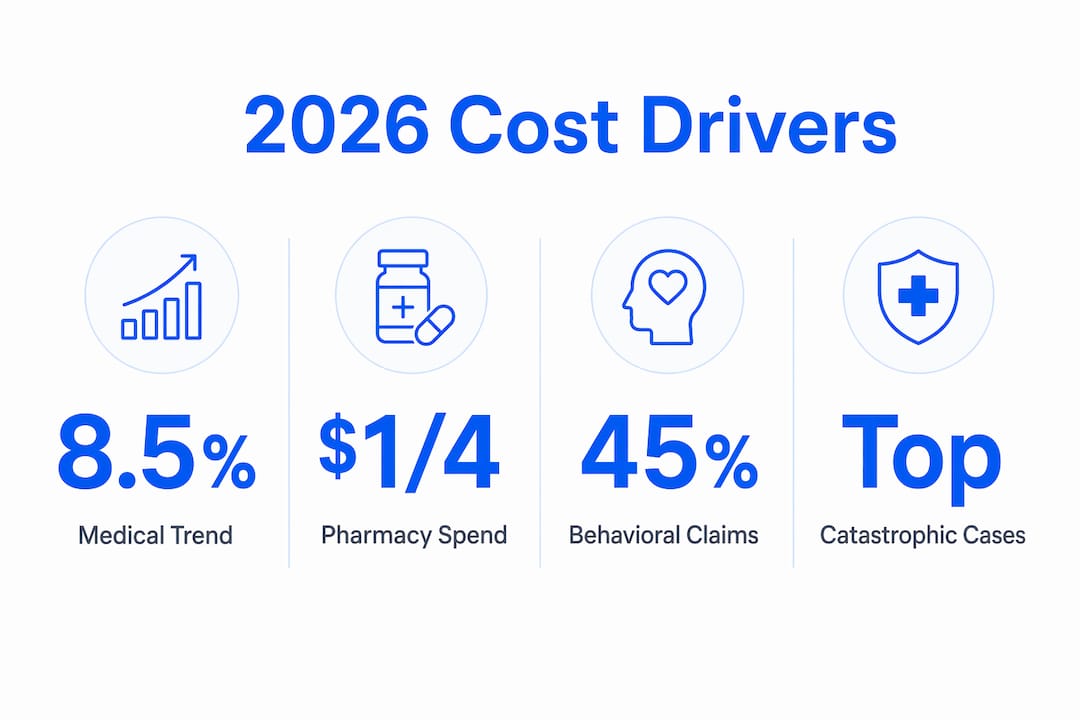
Pharmacy now accounts for roughly $1 of every $4 in total health spending for some employer populations, and the specialty tier is where the real pressure lives. GLP-1 drugs for obesity, oncology biologics, and emerging gene therapies are all contributing. The problem is not just unit cost; it is volume. More employees are qualifying for these therapies, and clinical guidelines are expanding indications.

| Cost Driver | Key Figure | Source |
|---|---|---|
| Medical trend projection (2026) | ~8.5% | UnitedHealthcare |
| Pharmacy cost increase (2025→2026) | ~10–12% | World Insurance / Market Reports |
| Specialty meds share of pharmacy spend | 55% | UnitedHealthcare |
| Catastrophic claims increase (>$100k) | +12.9% | UnitedHealthcare |
| Behavioral health claims increase (2023→2024) | ~45% | World Insurance / Market Reports |
| Employer-projected median trend (before plan design) | ~9% | Business Group on Health |
| Employer-projected median trend (after plan design) | ~7.6% | Business Group on Health |
Catastrophic claims: the unpredictable multiplier
A single NICU stay, a complex oncology case, or a rare disease diagnosis can add 1–2 percentage points to a small employer's trend in a single year. Stop-loss coverage helps, but proactive case management before a claim escalates is where the real savings live. Employers with robust nurse case management programs catch these cases earlier.
Behavioral health: volume and access together
The 45% year-over-year jump in behavioral health claims is partly real demand and partly a coding and access shift. More employees are seeking care, and more of that care is being documented. The challenge is that high-quality behavioral health providers are scarce in many markets, pushing utilization toward higher-cost settings. Employers investing in employee mental health programs that include virtual behavioral health and EAP integration are seeing better access without proportional cost increases.

Utilization patterns: the ER problem
The drop in virtual care and the rise in ER utilization is a site-of-care problem. When employees cannot navigate to the right setting, they default to the most expensive one. Generational differences matter here: younger employees tend to use urgent care and telehealth when it is easy to find; older employees and those with chronic conditions often default to the ER because they do not know their alternatives.
What should employers do to contain costs and protect access?
Translating trend data into benefit design decisions is where most HR teams get stuck. The levers below are ranked roughly by speed-to-savings and implementation complexity.
-
Integrated pharmacy-medical models. Treating pharmacy as a strategic lever rather than a passive expense line is the single biggest mindset shift for 2026. Integrated models align your PBM and medical carrier data so that a high-cost specialty drug claim triggers a clinical outreach, not just a remittance. Benefits leaders are scrutinizing PBM contracts and exploring transparent, pass-through arrangements that reduce rebate opacity.
-
Copay-driven plan designs alongside HDHPs. The all-HDHP strategy is losing ground. Employers are adding copay-driven options to reduce care avoidance, particularly for chronic condition management and preventive services. The trade-off is higher premium contribution, but the downstream savings from avoided ER visits and better medication adherence often offset it.
-
Prior authorization and step therapy for GLP-1s. Targeted prior auth for obesity medications is one of the fastest-ROI moves available right now. Requiring documented lifestyle intervention before approving a GLP-1 reduces inappropriate utilization without blocking access for clinically appropriate patients. Pair this with a medication adherence program to protect the investment once a drug is approved.
-
Preventive and whole-person health investments. Top-performing employers focus on what Business Group on Health calls "deflators": data-driven prevention, early intervention, and value-based partnerships. These reduce trend rather than shift cost to employees. The CDC's workplace health promotion framework provides a structured model for building these programs.
-
Care navigation and advocacy programs. Steering employees to high-value sites of care (ambulatory surgery centers over hospital outpatient, for example) can reduce per-episode costs materially. Navigation tools that integrate with your existing plan infrastructure are more effective than standalone apps employees never open.
Pro Tip: Before your next vendor review, pull your top 20 catastrophic claims from the past two plan years and map each one to a condition category. That single exercise will tell you where to focus your case management and disease management investments more accurately than any benchmark report.
How should you budget and forecast for 2026?
Scenario planning beats single-point estimates, especially in a year where trend uncertainty is high. Use three scenarios built around the UnitedHealthcare and Business Group on Health projections.
-
Base case (no plan design changes): Apply an 8.5–9% medical trend and a 10–12% pharmacy trend to your current per-employee per-year spend. This is your worst-case budget floor.
-
Moderate mitigation (targeted plan design changes): Apply the Business Group on Health finding that plan design adjustments can bring the median trend from ~9% down to approximately 7.6%. Interventions here include prior auth for high-cost specialty drugs, site-of-care steering, and adding a copay-based plan option.
-
Aggressive mitigation (full program integration): Layer in a population health program with evidence-based chronic disease management, preventive care outreach, and vendor accountability requirements. Employers running these programs can push trend below the 7.6% midpoint, though the timeline to full savings is typically 12–24 months.
Timeline guidance: Finalize your 2026 budget assumptions by the end of Q1 if you have not already. Vendor negotiations for plan year 2027 should begin no later than Q3 2026. Open enrollment communications need to be drafted by August to allow for legal review and employee education lead time. If you are modeling a plan design change, give your benefits broker the scenario parameters now so they can run carrier quotes in parallel.
What can AI and digital health realistically deliver in 2026?
AI's near-term value in employer health benefits is concentrated in navigation and care pathway improvement, not in replacing clinical judgment. Employers piloting AI-powered navigation are seeing the clearest returns in three specific use cases.
-
Site-of-care steering. Multi-agent AI tools can identify when an employee is about to schedule a high-cost hospital outpatient procedure and redirect them to an ambulatory surgery center or specialist with equivalent quality ratings at lower cost. This works best when the tool integrates with your carrier's claims data.
-
Prior-authorization automation. AI can reduce the administrative burden of prior auth by pre-populating clinical criteria from EHR data, cutting approval cycle times and reducing denials that lead to appeals and delays.
-
Predictive risk scoring. Identifying high-risk members before they generate catastrophic claims allows case managers to intervene earlier. The key is connecting the risk score to an actual outreach workflow, not just a dashboard.
-
Anticipatory benefits. The next stage beyond personalization is AI that nudges employees proactively: prompting medication refills before adherence lapses, scheduling preventive screens before a gap in care widens, or flagging a behavioral health need before it escalates. This approach is moving from pilot to production for leading employers in 2026.
Pro Tip: When evaluating any AI navigation vendor, ask for their claims-period methodology: specifically, how many months of baseline claims data they use, how they define "avoided" utilization, and what their reporting cadence is. A vendor that cannot answer those three questions in writing is not ready for enterprise deployment.
The Business Group on Health is direct about the governance requirement: employers should understand exactly how AI is being applied in any clinical setting before signing a contract, including whether AI is supplementing or replacing intake processes.
How do you measure impact and hold vendors accountable?
Measurement is where most employer health programs lose their credibility. Vendors report what makes them look good unless you specify otherwise in the contract.
Metrics to require in every vendor agreement:
- Percentage trend vs. a defined benchmark (not self-reported)
- Savings per employee per year, with baseline claims period specified
- Avoidable ER rate and change year over year
- Utilization of high-value sites of care as a percentage of total episodes
- Medication adherence rates for chronic condition populations
- Rebate pass-through detail for PBM arrangements (dollar amount, not just percentage)
Contract checklist items:
- Require the vendor to specify the claims-period sampling methodology (minimum 12 months of baseline, ideally 24).
- Require quarterly reporting, not annual. Annual reports hide mid-year deterioration.
- Demand rebate pass-through transparency: total rebates collected, total passed through, and the delta.
- Include stop-loss trigger language tied to catastrophic claim thresholds.
- Require case-management ROI guarantees with a defined measurement period and a clawback or credit mechanism if targets are missed.
A quarterly vendor scorecard should include at minimum: trend vs. benchmark, savings per employee, ER utilization rate, and adherence rates for your top three chronic conditions. If a vendor resists providing this data quarterly, that resistance is itself a signal.
Employers are also pushing for wellness program ROI data that ties prevention investments directly to claims reductions, not just participation rates.
Your 60–90 day action checklist for HR and benefits leaders
This checklist assumes you are starting now and targeting readiness for 2027 plan year negotiations while also capturing near-term wins.
-
Days 1–15: Pull your pharmacy spend audit (owner: benefits broker + PBM). Request a specialty drug utilization report broken out by therapeutic category. Identify your top 10 specialty drugs by total spend and by member count.
-
Days 1–15: Request baseline claims data from all vendors (owner: HR/benefits). Specify a 24-month baseline period. Ask each vendor to confirm their reporting methodology in writing.
-
Days 15–30: Run a utilization audit for ER and behavioral health (owner: carrier + HR). Identify what percentage of ER visits were classified as avoidable. Map behavioral health utilization by access point (in-network, out-of-network, virtual).
-
Days 30–45: Model three budget scenarios (owner: HR + finance). Use the base case (8.5–9% medical, 10–12% pharmacy), moderate mitigation (~7.6% with plan design), and aggressive mitigation (population health program integration) frameworks from the budgeting section above.
-
Days 30–60: Evaluate one AI navigation pilot (owner: benefits broker + HR). Define three KPIs before launch: site-of-care redirection rate, member satisfaction score, and cost per redirected episode.
-
Days 45–75: Review PBM contract for rebate transparency (owner: CFO + benefits broker). If your current PBM cannot provide a line-item rebate pass-through report, that is a contract renegotiation trigger.
-
Days 60–90: Finalize plan design changes for 2027 (owner: HR + carrier). If adding a copay-based option, model the premium impact and draft employee communication now. Enrollment communications need to be in legal review by August.
Quick wins (savings in 3–6 months): Prior auth for GLP-1s, catastrophic case management outreach for your top 10 high-cost claimants, and ER avoidance messaging tied to your care navigation tool.
Medium-term moves (12–24 months): Population health program integration, value-based care contracts with primary care networks, and full PBM rebate transparency renegotiation.
A population health program that reduced claims: what the evidence shows
The most credible evidence for employer health program ROI comes from structured, evidence-based population health programs that measure claims before and after intervention, not just participation.
A well-designed population health program targets chronic disease, preventive care, and employee engagement simultaneously. When employers implement evidence-based interventions across these three dimensions, integrated with their existing benefit plans, the result is measurable claims reduction without disrupting plan administration. The measurement approach matters as much as the intervention: baseline claims periods of 12–24 months, quarterly reporting, and per-employee savings figures tied to actual claims data are the standard for credible results.
Hadaco's programs are built on exactly this model. In their first year, companies working with Hadaco see an average savings of $451 per employee, with outcomes tracked through quarterly reporting tied to real claims data. The model is performance-based, meaning no upfront fees, and it complements existing plans rather than replacing them. For employers who want to see what their specific population might yield, Hadaco offers a transparent savings estimator that generates a tailored projection based on your workforce data.
Key Takeaways
Employer healthcare costs in 2026 are driven by specialty pharmacy, catastrophic claims, and behavioral health, and the employers who contain trend are those who treat prevention and vendor accountability as financial strategy, not HR overhead.
| Point | Details |
|---|---|
| Budget for 8.5–9% medical trend | Apply UnitedHealthcare's 8.5% projection as your base case before any plan design mitigation. |
| Plan design can cut trend to ~7.6% | Business Group on Health data shows targeted plan design changes reduce the median employer trend from ~9% to approximately 7.6%. |
| Specialty drugs are 55% of pharmacy spend | Audit your PBM contract and apply prior authorization for GLP-1s and oncology biologics as a near-term cost lever. |
| Require quarterly vendor reporting | Specify claims-period methodology, savings per employee, and rebate pass-through detail in every vendor contract. |
| Hadaco's performance-based model | Hadaco delivers average first-year savings of $451 per employee with no upfront fees, integrated with your existing plans. |
The case for bolder moves in 2026
Most benefits leaders I talk with are still treating 2026 as an incremental year: tweak the deductible, add a virtual care option, renegotiate the PBM contract at the margin. That approach will not hold. The cost pressures this year are structural, not cyclical. Specialty drug spend does not reverse when the economy improves. Catastrophic claims do not shrink because you raised the employee contribution. Behavioral health demand is not going away.
The employers who will look back at 2026 as a turning point are the ones who used this year to build the infrastructure for sustained deflation: evidence-based prevention programs, value-based vendor contracts with real accountability teeth, and care navigation that actually changes where employees get care. That is a harder conversation to have with leadership than a 2% premium increase, but it is the right one.
The affordability tension is real and worth naming directly. Moving away from HDHPs toward copay-driven designs costs money upfront. Investing in population health programs requires patience for the 12–24 month ROI window. Employees will push back on any change that feels like a benefit cut, even when the change is designed to protect their access. The answer is not to avoid the change; it is to communicate it with data. Show employees what the alternative looks like: higher out-of-pocket costs, narrower networks, and fewer preventive services. That framing changes the conversation.
Embed measurement from day one. Every vendor relationship, every new program, every plan design change should have a defined baseline, a defined measurement period, and a defined accountability mechanism. The employers who do that consistently are the ones who can actually tell their CFO what they got for the money.
Hadaco helps employers get ahead of 2026 cost pressures
The gap between knowing your trend is 8.5–9% and actually doing something about it is where most employers lose ground. Hadaco closes that gap with performance-based population health programs that address chronic disease, preventive care, and employee engagement without disrupting your existing benefit plans or requiring upfront fees.
The average employer in Hadaco's first year sees $451 in savings per employee, tracked through quarterly reporting tied to actual claims data. The model is built for accountability: you see the baseline, you see the intervention, and you see the result. If you want to know what your workforce's specific numbers might look like, the Hadaco savings estimator generates a tailored projection in minutes. For a deeper conversation about your 2026 strategy, book a consultation directly at hadaco.com.
Primary sources and further reading
The projections and employer survey data in this article draw from a set of primary reports that HR and benefits teams should have on file for their own planning and vendor negotiations.
-
UnitedHealthcare 2026 Health Trends Report: Projects 8.5% medical trend, 11% pharmacy increase, and 12.9% rise in catastrophic claims. Includes utilization data on virtual care and ER shifts. Claims data sampled from UnitedHealthcare's commercial book of business.
-
Business Group on Health 2026 Employer Health Care Strategy Survey: Employer-survey-based projection of ~9% median trend, reducing to ~7.6% with plan design changes. Covers PBM scrutiny, vendor accountability, and prevention priorities.
-
Business Group on Health 2026 Trends to Watch: Qualitative analysis of the strategic forces shaping employer health strategy, including AI, pharmacy disruption, and workforce demographics.
-
World Insurance 2026 Employee Benefits Market Outlook: Projects 10–12% pharmacy cost increases and documents the 45% behavioral health claims increase from 2023 to 2024.
-
CDC Workplace Health Promotion: The CDC's framework for building evidence-based workplace health programs, including the Worksite Health ScoreCard and Work@Health training curricula.
-
HRTechCube: 2026 Benefits Trends: Covers HDHP enrollment trends, HSA engagement, and employer pilots of AI-powered navigation tools.
Note: Projection figures in these reports reflect claims data sampled from specific plan years and commercial populations. Employers should request the methodology footnotes directly from each vendor when using these figures in internal planning documents. Original slide decks and data feeds are typically available from your carrier or benefits consultant upon request.