
HR can cut employer healthcare trend materially by combining targeted plan design changes, claims analytics, pharmacy controls, and employee engagement — not by blanket benefit cuts. Finance now expects benefits decisions to show measurable ROI, which means the old playbook of shifting costs to employees is both a retention risk and a credibility problem. The three highest-leverage levers are plan design (network steering, site-of-care routing, reference-based pricing), data and predictive analytics (claims PMPM, high-cost claimant identification, pharmacy trend), and pharmacy controls (PBM transparency, GLP-1 management, specialty drug stewardship).
Before your next renewal, take these three steps:
- Pull a claims data summary: PMPM trend, top five diagnosis drivers, pharmacy spend as a percent of total, and the share of spend concentrated in the top 1% of members.
- Trigger a PBM contract review: request a rebate passthrough audit and confirm whether your current contract is pass-through or spread-based.
- Pilot one site-of-care change: redirect imaging or infusion to lower-cost outpatient or home settings and measure the per-unit cost difference.
When you bring this to finance, frame it as a 60–90 day analytics project to quantify ROI before committing to full program changes. That framing converts a benefits conversation into a capital-allocation conversation, which is the language CFOs respond to.
Table of Contents
- What plan design levers actually move the needle for HR?
- How does employee engagement actually lower healthcare costs?
- What pharmacy levers should HR prioritize right now?
- When does it make sense to consider self-funding, captives, or value-based contracts?
- Your 90–180 day implementation checklist
- Key Takeaways
- The case for treating HR and finance as cost-containment partners
- Ready to see what Hadaco can save your organization?
- Useful sources and further reading
What plan design levers actually move the needle for HR?
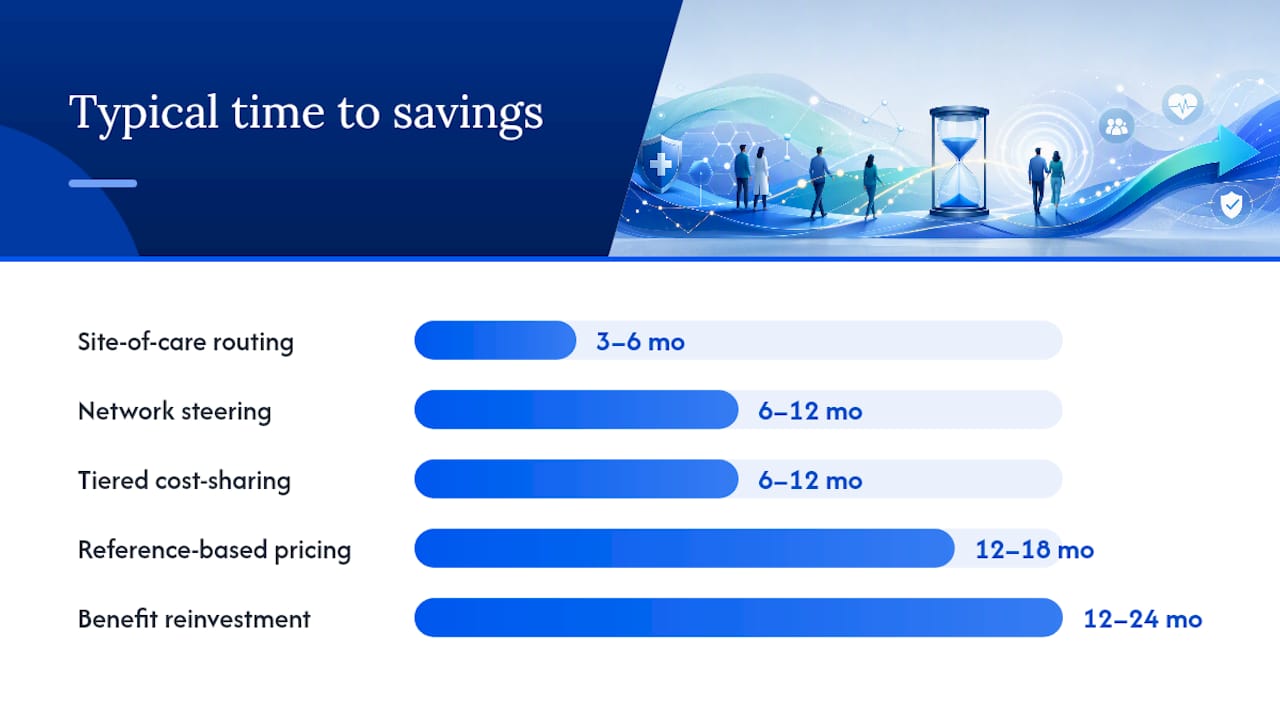
Plan design is where most of the controllable cost lives, and the right levers depend heavily on your population size, risk profile, and how much disruption your workforce can absorb. The table below maps the highest-impact options.
| Lever | Best fit | Typical time to savings | Key implementation risk |
|---|---|---|---|
| Network steering (tiered or narrow network) | 200+ employees, concentrated geography | 6–12 months | Employee backlash if preferred providers are excluded |
| Reference-based pricing (RBP) | Self-funded employers, opaque local markets | 12–18 months | Balance billing disputes; requires robust member advocacy |
| Site-of-care routing (imaging, infusion, labs) | Any size; high imaging or infusion utilization | 3–6 months | Requires decision-support tools and clear member communication |
| Tiered cost-sharing (value-based design) | Chronic disease populations | 6–12 months | Complexity in plan documents; ERISA review needed |
| Benefit reinvestment (lower primary care/mental health barriers) | Populations with deferred preventive care | 12–24 months | Requires savings from other levers to fund |
The Commonwealth Fund's analysis of state cost-growth strategies confirms that population-based payment and provider rate controls are among the most durable levers at scale. Employers can replicate the logic through RBP and value-based contracts with high-volume providers.
When presenting trade-offs to finance, model two scenarios: one where cost-sharing increases absorb the trend (employee affordability risk goes up) and one where plan design changes redirect utilization without raising out-of-pocket costs. The second scenario is harder to execute but produces better retention outcomes. Benefit reinvestment, where savings from site-of-care or RBP fund lower copays for primary care or mental health, is the most defensible story to tell both finance and employees.
Pro Tip: Before rolling out any plan design change company-wide, run a 90-day pilot at one or two sites. Measure utilization shifts and track member complaints. This limits legal exposure under ERISA and gives you real data to defend the change to finance and the workforce.
How does employee engagement actually lower healthcare costs?
Engagement is the lever most HR teams underestimate, partly because it is hard to measure and partly because generic wellness programs have a poor track record. The distinction is between programs that change utilization behavior and programs that just generate participation metrics.
High-impact engagement tactics that move costs:
- Care navigation: a live or digital navigator who helps members find in-network, lower-cost providers for scheduled procedures can redirect spend before it happens. SHRM's health care cost management toolkit identifies care navigation as one of the fastest wins available to employers.
- Targeted outreach for high-risk members: proactive outreach for members with unmanaged chronic conditions (diabetes, hypertension, musculoskeletal) produces measurable reductions in downstream acute care. See wellness incentive design that drives real participation for engagement structures that work.
Timing matters as much as the tactic. Year-round nudges (monthly health tips, biometric screening reminders) keep engagement from collapsing between open enrollment windows. Manager briefings before open enrollment give front-line supervisors the language to answer employee questions without creating confusion. Measuring waiver rates and claim deferral signals (members who stop filling maintenance medications, for example) gives HR an early warning that cost-sharing changes are causing care avoidance rather than appropriate utilization shifts.
Pro Tip: When introducing site-of-care steering or network changes, lead the communication with what employees gain (lower out-of-pocket costs, easier scheduling, telehealth access) before explaining what changes. Framing the change as a benefit improvement rather than a restriction reduces backlash by a significant margin and keeps HR out of a defensive posture.
What pharmacy levers should HR prioritize right now?
Pharmacy is where employer plan costs are accelerating fastest. HUB International's Breaking the Cost Cycle Report projects medical trend rising roughly 9% in 2026, with specialty drugs representing a disproportionate share of total pharmacy spend. GLP-1 uptake for weight loss is a primary driver, and most employers have not yet built the guardrails to manage it sustainably.
GLP-1 management
Covering GLP-1 drugs for type 2 diabetes and cardiovascular indications is clinically defensible. Covering them for weight loss without guardrails is a budget risk. A sustainable GLP-1 program includes:
- Indication-based coverage criteria (FDA-approved diagnoses only, documented in the prior authorization process)
- Step therapy requiring a structured lifestyle program before or concurrent with drug initiation
- Six-month clinical reviews with documented outcomes (weight, A1C, cardiovascular markers)
- Discontinuation protocols for members who do not meet response thresholds
Pairing GLP-1 access with a population health program that includes lifestyle coaching and chronic disease management makes the coverage sustainable and defensible to finance.
Specialty drug controls
Biosimilar adoption for biologics (adalimumab, for example) can reduce per-claim costs materially where biosimilars are available. Site-of-care for infused specialty drugs, shifting from hospital outpatient to physician office or home infusion, is one of the highest-ROI moves available. Dose optimization reviews for oncology and autoimmune drugs, conducted by a specialty pharmacy partner, catch waste before it compounds.
When does it make sense to consider self-funding, captives, or value-based contracts?
Alternative funding models are not right for every employer, but for those who qualify, they are among the most durable cost-containment tools available.
- Self-funding: makes sense for employers with 200 or more employees, reliable claims data, and a stop-loss strategy. Self-funded plans give HR direct access to claims data, eliminate insurer profit margin from the premium, and allow plan design flexibility that fully insured products do not. The prerequisite is a credible stop-loss arrangement (specific and aggregate) and a TPA with strong network and analytics capabilities.
- Captives: mid-market employers (roughly 50–200 employees) who want the economics of self-funding but need predictability can join a group captive. Captives pool stop-loss risk across multiple employers, reducing volatility while preserving data access and plan design control.
- Reference-based pricing: works best in markets where hospital pricing is opaque and the employer has the member advocacy infrastructure to handle balance billing disputes. State-level evidence on provider rate controls shows that capping rates relative to Medicare benchmarks produces real savings; RBP applies the same logic at the employer level.
- Value-based contracts: direct contracts or ACO arrangements with high-volume providers make sense where a provider system has the infrastructure for risk-sharing. These take 18–36 months to negotiate and implement but can produce sustained unit-cost reductions and quality improvements.
Implementation prerequisites for any of these models: at least 24 months of clean claims data, a stop-loss or risk-management strategy, legal review of plan documents under ERISA, and a vendor or TPA with integration capabilities that match your HRIS and benefits administration platform.
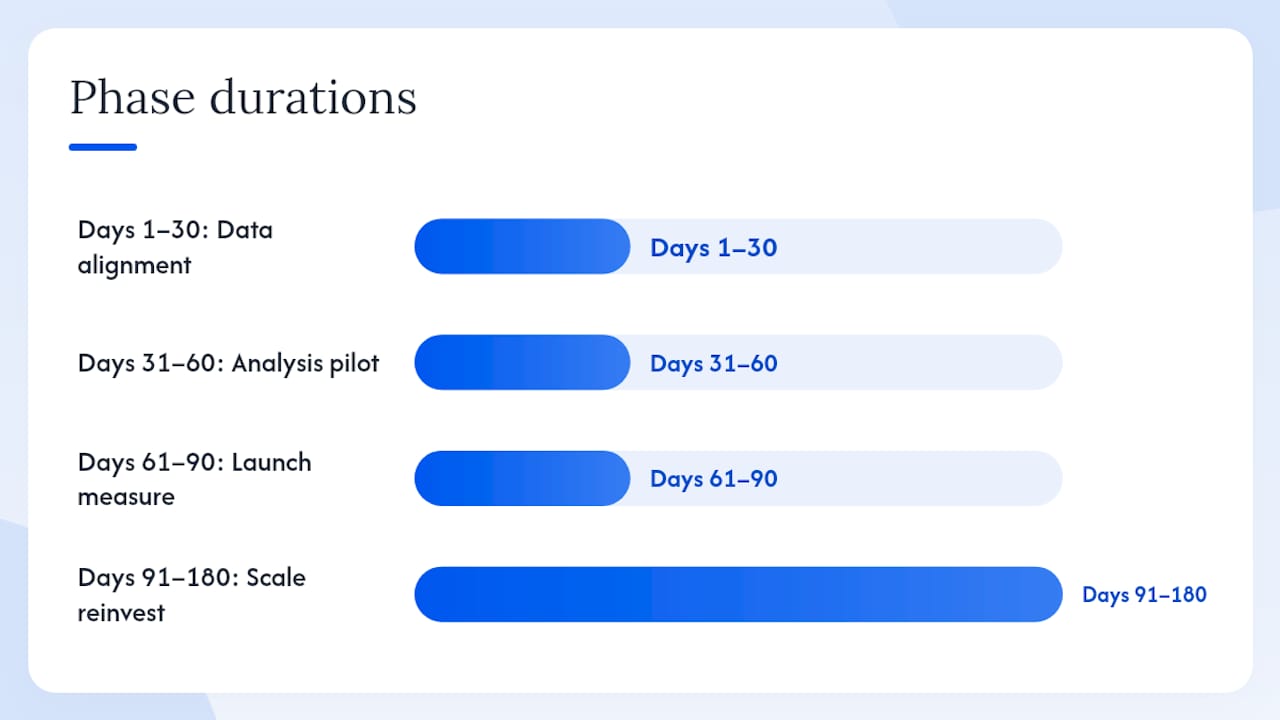
Your 90–180 day implementation checklist
A cost containment program fails most often not because the strategy is wrong but because the rollout lacks clear ownership and compliance review. Here is a structured timeline.
Days 1–30: Data and stakeholder alignment
- Assign a project owner (HR lead) and a finance sponsor; schedule monthly steering committee.
- Pull 24 months of claims data from TPA or carrier; request pharmacy data from PBM.
- Conduct a dependent eligibility audit and payroll reconciliation to surface quick wins.
- Brief legal counsel on planned changes; initiate ERISA plan document review.
- Identify broker or benefits consultant to support vendor evaluation.
Days 31–60: Analysis and pilot design
- Complete claims analysis: PMPM trend, top diagnosis drivers, high-cost claimant profile, pharmacy breakdown.
- Select one or two pilot levers (site-of-care routing and/or telehealth expansion are lowest-risk starting points).
- Draft employee communication plan; review for HIPAA compliance before distribution.
- Confirm ACA minimum value and affordability thresholds are maintained under any plan design change.
- Issue RFP or request proposals from population health vendors, PBM auditors, or care navigation partners.
Days 61–90: Launch and measure
- Implement pilot changes with a defined measurement period (minimum 90 days of claims data post-launch).
- Distribute employee communications; schedule manager briefings.
- Establish quarterly reporting cadence to finance using the KPI template above.
- Review vendor contracts: tie fees to measurable outcomes and require quarterly data reporting and audit access.
Days 91–180: Scale and reinvest
- Analyze pilot results; present finance case for scaling successful levers.
- Initiate PBM contract renegotiation or audit if rebate passthrough is not confirmed.
- Design reinvestment plan: use documented savings to reduce primary care or mental health cost-sharing.
- Conduct an employee health risk assessment to stratify the population and prioritize chronic disease interventions for Year 2.
Compliance touchpoints (one-sentence guidance only; confirm specifics with legal counsel):
- ACA: any plan design change must maintain minimum essential coverage, minimum value (60% actuarial value), and affordability thresholds for applicable large employers.
- ERISA: material plan changes require updated Summary Plan Descriptions and timely notice to participants.
- HIPAA: claims data used for analytics must be de-identified or handled under a Business Associate Agreement with any vendor receiving PHI.
Pro Tip: When contracting with population health or analytics vendors, require quarterly reporting that includes claims-level outcome data, not just program participation metrics. Tie at least a portion of vendor fees to demonstrated PMPM reduction or high-cost claimant avoidance. Vendors who resist this structure are telling you something important about their confidence in their own results.
Key Takeaways
HR can contain employer healthcare costs without cutting core benefits by combining targeted plan design, claims analytics, pharmacy controls, and population health programs that tie vendor fees to measurable PMPM reduction.
| Point | Details |
|---|---|
| Start with claims data | Pull 24 months of PMPM, pharmacy, and high-cost claimant data before any plan design change. |
| Pharmacy controls are urgent | PBM rebate passthrough, GLP-1 guardrails, and biosimilar adoption address the fastest-growing cost driver. |
| Tie vendor fees to outcomes | Require quarterly claims-level reporting and performance-based contracts from every population health vendor. |
| Present ROI to finance | Build a business case with projected PMPM reduction, reinvestment plan, and net recurring savings to earn CFO support. |
| Hadaco as a starting point | Hadaco's no-upfront-fee, performance-based model averages $451 in per-employee savings in year one with transparent quarterly reporting. |
The case for treating HR and finance as cost-containment partners
The conventional framing of healthcare cost containment treats it as a benefits problem: HR finds the savings, finance approves the budget, and employees absorb the changes. That framing produces the wrong incentives. When HR is accountable only for premium trend and finance is accountable only for the bottom line, the easiest solution is always cost-shifting, which erodes benefits, damages retention, and eventually shows up as a workforce productivity problem that costs more than the original premium savings.
The more defensible approach is to treat workforce health as a capital allocation question. Every dollar spent on a well-designed chronic disease program, a care navigation tool, or a pharmacy management protocol is competing against the cost of a hospitalization, a disability claim, or a turnover event. When HR brings finance a business case that includes disability, absenteeism, and turnover costs alongside PMPM trend, the math changes. The programs that look expensive on a per-member basis often look cheap when the downstream costs they prevent are included.
The data-first discipline matters here. Finance will not fund a program because it sounds good. They will fund one that shows a credible projected PMPM reduction, a defined measurement methodology, and a reinvestment plan that returns some savings to employees. That is the conversation HR should be preparing for, and the analytics playbook in this guide is the preparation.
Ready to see what Hadaco can save your organization?
If your renewal is coming up and you do not yet have a claims-level savings estimate, that is the gap Hadaco closes first.
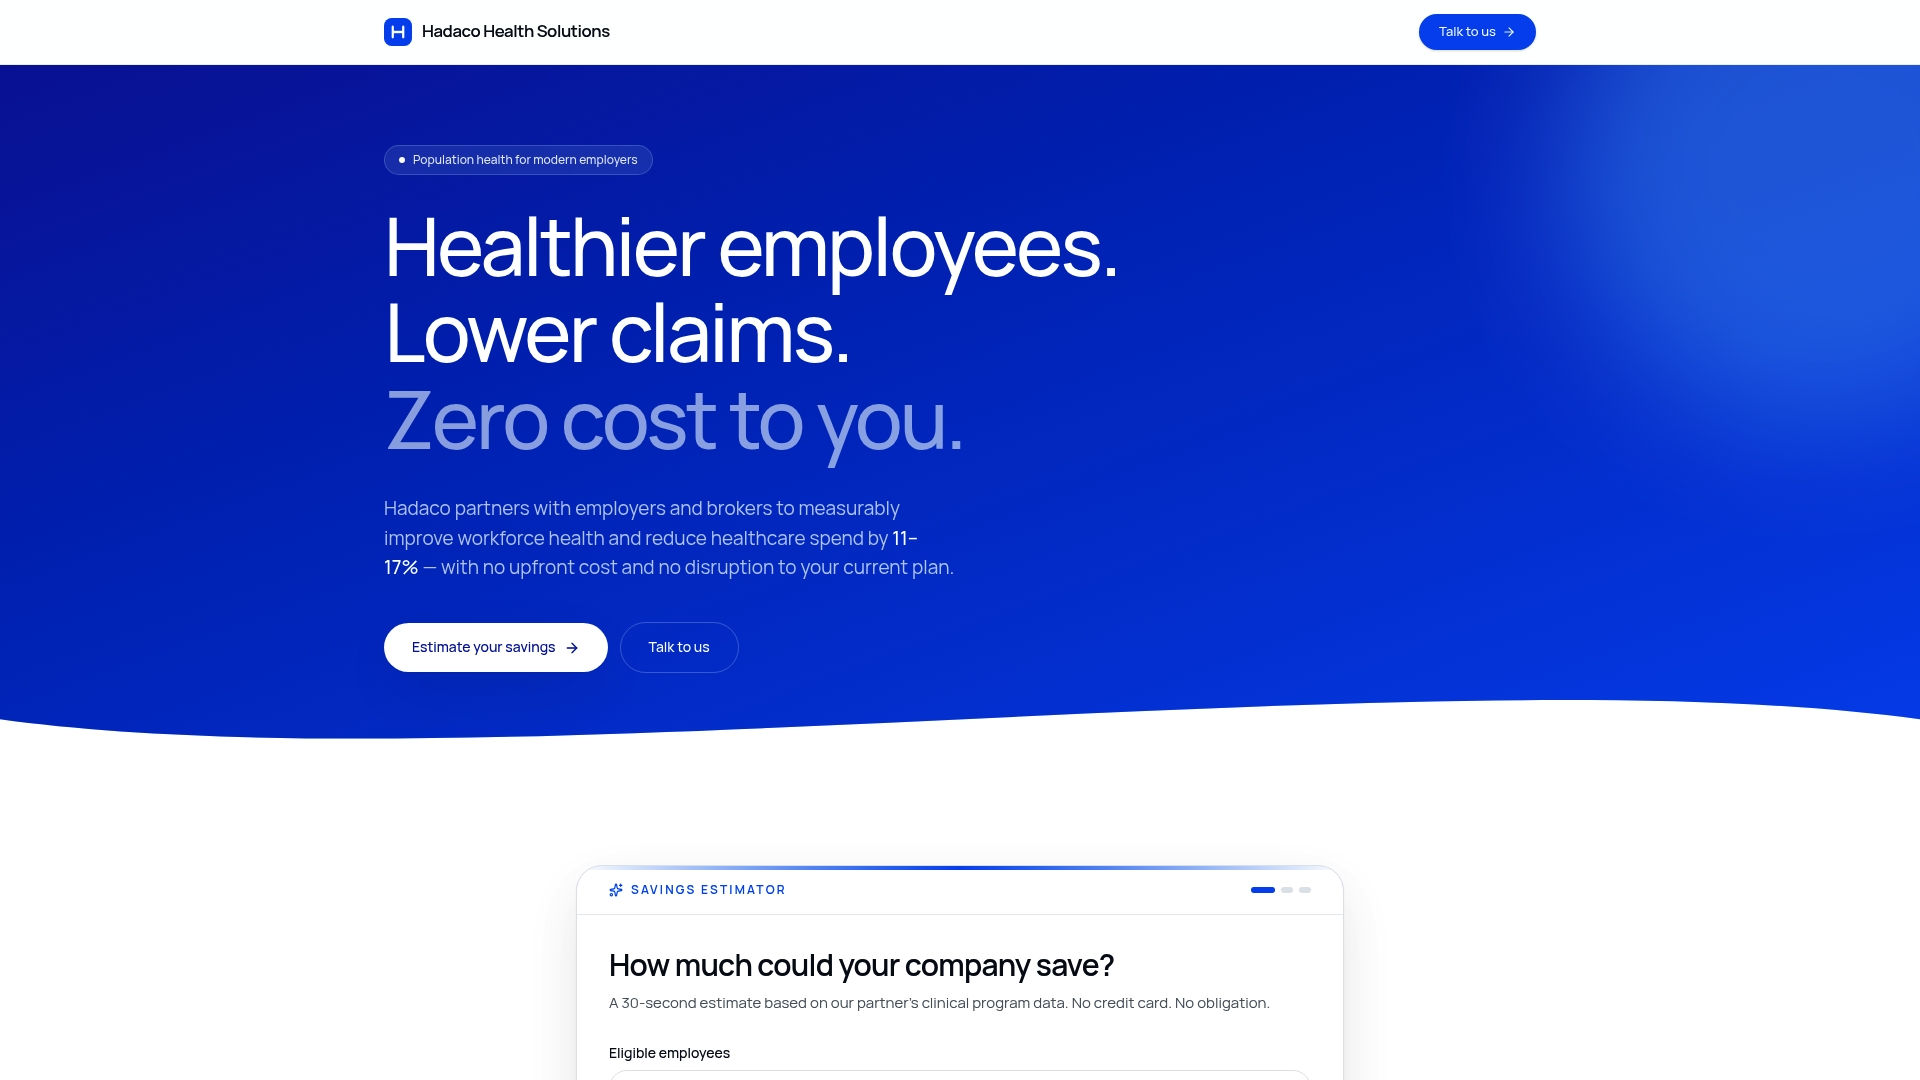
Hadaco's population health programs deliver average first-year savings of $451 per employee, with no upfront fees and performance-based pricing tied to actual claims outcomes. The transparent savings estimator gives HR a defensible number to bring to finance before any program commitment. Quarterly reporting keeps both HR and the CFO accountable to real data, not participation counts.
Request a savings assessment at Hadaco to see a projected PMPM reduction for your population. The estimate is built from your actual plan data, which means it is a finance-ready figure from day one.
Useful sources and further reading
The sources below back the key claims in this guide and are worth bookmarking for deeper work on specific levers.
- Rising benefits costs are forcing HR to get smarter, not leaner | Human Resources Director
- State strategies for slowing health care cost growth in the commercial market | Commonwealth Fund
- Breaking the Cost Cycle Report (HUB International)
- Healthcare cost containment strategies: 3 proven ways hospitals can reduce costs | HFMA
- Toolkit: Essential health care cost management strategies | SHRM
- The HR leader’s healthcare affordability playbook: How to be an agent of change | Imagine360
- Employee Benefits Cost Containment: Overcome 3 Roadblocks | Benefitfocus
- Health care cost containment strategies | McKesson Medical-Surgical
This article is general information for HR and benefits professionals, not legal, tax, or clinical advice. Confirm ACA, ERISA, and HIPAA requirements with qualified legal counsel and verify current regulatory thresholds with the relevant federal agencies before implementing plan changes.