
Prioritize early identification using integrated claims and pharmacy data, lock in contractual data access with every vendor, and deploy targeted clinical intervention for flagged members. Those three moves, executed in the first 30–90 days, do more to control expensive claimants than any single benefit redesign. According to SHRM, managing high-cost claimants is already the top health savings strategy employers are pursuing, and the plans that move fastest on identification and intervention consistently outperform those that wait for the stop-loss bill to arrive.
Here is your 30–90 day starter checklist:
- Days 1–15 (Benefits/HR lead): Pull the last 24 months of paid claims and pharmacy data. Identify every member above $50K in annual spend. Confirm your TPA contract includes line-level data access and a 30-day reporting SLA.
- Days 15–30 (HR + stop-loss carrier): Verify current stop-loss attachment points and confirm which members are already in a specific-deductible corridor. Notify your stop-loss carrier of any known high-cost cases immediately.
- Days 30–60 (HR + clinical vendor or case manager): Assign a nurse case manager or care navigator to each flagged member. Initiate outreach within 72 hours of flagging.
- Days 60–90 (HR + finance + procurement): Audit vendor data feeds for completeness. Set a quarterly KPI review cadence. Begin renegotiating any vendor contract that lacks audit rights.
Pro Tip: *Site-of-care redirection is the fastest, lowest-friction win available.
Key Takeaways
Proactive identification, contractual data access, and integrated clinical intervention are the three levers that consistently reduce high-cost claimant spend for self-funded employers.
| Point | Details |
|---|---|
| Identify early, not reactively | Flag members above $25K–$50K using combined dollar and clinical triggers before spend escalates. |
| Lock in data rights contractually | Require line-level claims data, 30-day SLAs, and audit rights from every TPA, PBM, and stop-loss vendor. |
| Integrate clinical and behavioral health | Case management that includes mental health and nutrition closes the gaps most likely to drive ER visits and hospitalizations. |
| Measure with a defined baseline | Track PMPM trend, HCC persistence rate, and engagement rate against a 12-month pre-program baseline. |
| Hadaco delivers the full program | Hadaco's no-upfront-fee population-health program averages $451 in savings per employee in year one, with quarterly outcome reporting. |
Table of Contents
- What counts as a high-cost claimant, and why it matters to your plan
- How do you define thresholds and flag rising-risk members?
- Data and analytics: what you need, how to centralize it, and common pitfalls
- What early clinical interventions actually reduce escalation?
- Benefit design, stop-loss, and pharmacy strategies to limit employer exposure
- Compliance checklist: ADA, HIPAA, ACA, and ERISA when managing claimants
- Vendor accountability: contracting TPAs, PBMs, stop-loss, and care management partners
- How to measure impact: KPIs, reporting cadence, and attribution
- How a population-health program reduces high-cost claimants: a client-case model
- What HR leaders consistently get wrong, and what to fix first
- Hadaco's employer program delivers the playbook, not just the plan
- Sources
What counts as a high-cost claimant, and why it matters to your plan
The industry term is "high-cost claimant" (HCC), sometimes called a "catastrophic claimant" when spend is acute and concentrated in a single episode. The National Alliance for Health reports that employers most commonly use a $100,000 threshold as their primary cutoff, with many also applying a lower $50,000 tier to catch rising-risk members before they cross into catastrophic territory.
Tiered thresholds make practical sense. A member who hits $60,000 in a plan year for a new specialty drug fill is a very different risk profile from a member who generates $400,000 in a single neonatal ICU stay. Treating both identically wastes case management capacity. A tiered approach lets you separate persistent high-cost members from one-time catastrophic events and allocate intervention resources accordingly.
The dominant clinical drivers are cancer (often the single largest category), neonatal and obstetric complications, cardiovascular events, sepsis, specialty drugs, and emerging gene therapies. Employers are also reporting a notable shift: younger members are generating more high-cost claims than in prior years, and mental health comorbidity is increasingly present alongside the physical diagnoses driving spend.
Industry data point: Lockton's 2025 High-Cost Claimant Report finds that a small percentage of an employer's members with very high annual claims can account for roughly one-third of total plan spend. That concentration is why even a modest improvement in early identification and intervention moves the needle on total plan cost.
The volatility of this population is equally important. Most members who are high-cost in one year are not high-cost the next, which means a purely reactive strategy, one that only responds after spend has occurred, misses the window for meaningful intervention almost every time.
How do you define thresholds and flag rising-risk members?
Setting a threshold is not a one-time decision. It is an operational policy that needs to be revisited annually as your population, plan design, and drug pipeline change.
A practical tiered threshold strategy
Most employers benefit from at least two tiers:
- Rising-risk tier ($25K–$50K): Members approaching the lower threshold who have a diagnosis cluster associated with escalation (cancer staging, new specialty drug fills, recent inpatient admission). Flag for proactive outreach and care navigation.
- High-cost tier ($50K–$100K): Active case management assignment, stop-loss carrier notification, and monthly spend monitoring.
- Catastrophic tier (above $100K): Dedicated case manager, COE referral review, benefit exception review, and weekly clinical updates.
Combining a dollar trigger with a clinical trigger is more predictive than either alone. A member at $30K in paid claims with a new oncology diagnosis is a higher priority than a member at $45K for a single orthopedic procedure with no chronic comorbidities.
Minimum data fields for a flagging rule
To build a reliable flagging matrix, you need: claims paid to date (current plan year), allowed amounts by claim line, primary and secondary diagnosis codes (ICD-10 clusters), specialty drug fills from the pharmacy benefit manager, recent inpatient episodes (admit date, length of stay, DRG), and any prior authorization activity for high-cost therapies.
| Tier | Dollar Trigger | Clinical Trigger | Action Owner | Outreach Timeline |
|---|---|---|---|---|
| Rising-risk | $25K–$50K YTD | Oncology Dx, new specialty Rx, or inpatient admit | Care navigator | Within 5 business days |
| High-cost | $50K–$100K YTD | Any chronic condition with escalating utilization | Nurse case manager | Within 72 hours |
| Catastrophic | Above $100K YTD | Any | Dedicated case manager + stop-loss carrier | Within 24 hours |
Validation checklist for HR:
- Share the flagged member list (de-identified for HIPAA compliance) with your clinical vendor or case management team monthly.
- Confirm each flag against the stop-loss carrier's specific deductible corridor list.
- Review flags with your TPA's clinical liaison quarterly to catch members who may have been miscoded or missed.
- Document every outreach attempt and clinical touchpoint for audit purposes.
Data and analytics: what you need, how to centralize it, and common pitfalls
The gap between employers who successfully reduce high-cost claims and those who don't usually comes down to data, specifically who owns it, how fast they get it, and whether it is clean enough to act on.
Data sources to secure
You need medical claims (line-level, with allowed amounts and paid amounts), pharmacy claims (including specialty fills and NDC codes), enrollment and eligibility files, stop-loss specific-deductible reports, clinical vendor notes from case managers, and social determinants of health data where available. Each source adds a layer. Pharmacy data alone misses infusions billed to the medical benefit. Medical claims alone miss adherence gaps that predict future hospitalizations.
MedInsight's analytics framework makes the case clearly: predictive models that integrate medical and pharmacy data identify rising-risk members earlier and give care managers a precise intervention target rather than a retrospective cost report.
On data integration: Handling pharmacy in isolation misses cost-shifting opportunities. A specialty biologic billed to the medical benefit and the same drug billed to the pharmacy benefit look like two separate problems in siloed reporting. Combined, they reveal the full cost picture and the right lever to pull.
Centralizing the data
A centralized data warehouse with normalized fields, regular automated feeds from each vendor, and contractual guarantees for timeliness is the operational backbone. Without it, you are reconciling spreadsheets from three vendors every quarter and making decisions on data that is 60–90 days stale.
Common pitfalls to avoid contractually:
- Restricted PBM extracts: Some PBMs deliver only summary-level pharmacy data by default. Your contract must specify line-level NDC data with days' supply and prescriber NPI.
- Missing allowed amounts: TPAs sometimes deliver paid amounts without allowed amounts, which makes cost-shifting analysis impossible. Require both fields explicitly.
- Delayed stop-loss reporting: Stop-loss carriers often report on a lag. Negotiate a 30-day maximum reporting delay and a monthly data feed, not quarterly.
That recovery alone often covers the audit cost, and the audit also surfaces data-quality issues your TPA may not volunteer.*
For a deeper look at how centralized data warehouses support employer analytics, this overview of employer healthcare trends covers the data architecture decisions benefits leaders are making now.
What early clinical interventions actually reduce escalation?
The window for clinical intervention is narrow. Once a member is already generating $200,000 in claims, the opportunity to change trajectory is largely gone. The programs that work are the ones that engage members before the catastrophic episode, not after.

High-value program elements
Nurse outreach and care navigation are the entry point. A nurse case manager who contacts a newly diagnosed cancer patient within 72 hours of the diagnosis claim can coordinate specialist referrals, review the treatment plan for clinical appropriateness, and connect the member to a center of excellence (COE) before a suboptimal treatment path is locked in. COE referrals for complex oncology, cardiac surgery, and transplant cases consistently show better clinical outcomes and lower total episode costs.
Precision diagnosis support, where a specialist reviews the initial diagnosis and treatment plan for accuracy, catches misdiagnoses and inappropriate treatment protocols that drive unnecessary spend. Preauthorization review for specialty therapies, particularly gene therapies and high-cost biologics, adds a clinical appropriateness gate before the spend occurs.
On integrated behavioral health: CDC data confirms that mental health conditions frequently coexist with chronic physical illness and amplify both utilization and cost. A member managing diabetes who also has untreated depression is significantly more likely to miss medication doses, skip follow-up appointments, and end up in the emergency room. Integrating behavioral health screening and support into chronic disease case management is not a wellness add-on; it is a cost containment lever.
Nutrition therapy is similarly underused. Dietitian-delivered nutrition intervention for members with diabetes, cardiovascular disease, or obesity reduces medication reliance and downstream hospitalization risk. It is reimbursable as a clinical service under many plan designs and delivers measurable outcomes within 6–12 months.
Pro Tip: When you integrate mental health and nutrition into chronic disease case management, you close the two gaps most likely to send a member back to the hospital. Build them into the case management protocol as standard touchpoints, not optional referrals.
For employers building out medication adherence programs alongside case management, adherence interventions reduce the downstream high-cost events that adherence gaps predictably cause.
Benefit design, stop-loss, and pharmacy strategies to limit employer exposure
Plan design and pharmacy management are the structural layer underneath clinical intervention. Get them wrong and even excellent case management cannot offset the financial exposure.
Stop-loss design choices
Specific stop-loss coverage kicks in when a single member's claims exceed your attachment point, typically set between $75,000 and $250,000 depending on group size and risk tolerance. Aggregate stop-loss covers total plan spend above a corridor. The interaction between the two matters: a lower specific attachment point reduces per-member catastrophic exposure but raises premium. Lasering, where the carrier excludes a known high-cost member from the specific deductible, is a common carrier tactic at renewal. Negotiate anti-laser provisions or caps on laser surcharges in advance, not at renewal.
On stop-loss timing: Predictive identification of high-cost members gives you leverage in stop-loss negotiations. If you can show your carrier a documented intervention program with engagement data, some carriers will price the risk more favorably because the program reduces their expected payout.
Pharmacy levers beyond prior authorization
Prior authorization is table stakes. The higher-impact levers are biosimilar adoption (requiring step therapy to a biosimilar before approving the reference biologic), formulary design that places high-cost biologics on specialty tiers with meaningful cost-sharing, and site-of-care optimization for infusions. Moving infusion therapy from a hospital outpatient department to a home infusion or physician office setting can generate significant savings per infusion episode, with no change to the clinical protocol.

Specialty carve-in versus carve-out is a structural decision with real financial consequences. Carving specialty pharmacy into the medical benefit gives you integrated data but may reduce PBM rebate leverage. Carving it out to a specialty PBM gives you rebate optimization but creates the data-siloing problem described earlier. Neither is universally correct; the right answer depends on your drug mix and data architecture.
Pro Tip: Align benefit design changes with your plan year renewal and vendor contract cycles. A formulary change that takes effect mid-year without corresponding PBM system updates creates coverage gaps and member complaints that cost more to resolve than the savings generated.
Compliance checklist: ADA, HIPAA, ACA, and ERISA when managing claimants
Every intervention strategy must be built on a legally defensible foundation. The compliance framework is not optional, and it is not a formality.
Core compliance checklist for HR:
- HIPAA: Use only de-identified or minimum-necessary data for population-level analytics. Any individual outreach must go through a covered entity (your TPA, case management vendor, or health plan) under a valid Business Associate Agreement. HR staff should not have access to individual member diagnoses.
- ADA: Clinical outreach and case management programs must be voluntary. You cannot penalize a member for declining to participate in a disease management program. Reasonable accommodation obligations apply if a member's condition affects their ability to work.
- ACA: Essential health benefits must be preserved in any plan design change. Mental health and substance use disorder benefits must be covered at parity with medical and surgical benefits under the Mental Health Parity and Addiction Equity Act (MHPAEA). Site-of-care changes cannot effectively eliminate coverage for a required benefit.
- ERISA: Plan amendments that materially affect benefits require advance notice to participants (typically 60 days for significant changes). Vendor contracts must include fiduciary-appropriate terms. Stop-loss arrangements must be structured to avoid inadvertently creating a separate insurance product subject to state regulation.
Legal guardrail: Keep all clinical engagement voluntary, documented, and clinically appropriate. Any program that conditions benefits on health status or participation in a wellness activity must comply with HIPAA wellness program rules and ACA nondiscrimination requirements. When you are changing plan terms that affect benefits, involve ERISA counsel before finalizing vendor contracts or plan documents.
Documentation best practices: Maintain records of every outreach attempt, member response, and clinical touchpoint. Document the clinical rationale for any benefit exception or COE referral. If a member declines case management, document the declination. These records are your defense in a DOL audit or member grievance.
Vendor accountability: contracting TPAs, PBMs, stop-loss, and care management partners
Your vendors hold the data, execute the interventions, and process the claims. If your contracts do not hold them accountable, your program is built on goodwill rather than governance.
Must-have contract clauses
Every TPA, PBM, stop-loss carrier, and care management vendor contract should include: explicit data access rights (line-level, timely, in a machine-readable format), SLAs for reporting timeliness (30-day maximum lag for claims data), audit rights allowing a third-party review of claims adjudication and data accuracy, transparency on PBM rebates and administrative fees (pass-through vs spread pricing), and measurable performance KPIs with defined consequences for non-performance.
On vendor transparency: The National Alliance's employer survey found that employers who secured contractual data access and standardized reporting across vendors were significantly better positioned to identify and intervene on high-cost cases. Employers who relied on vendor-generated summary reports consistently had blind spots in their data.
Vendor governance checklist:
- Monthly operational scorecard review with each major vendor (TPA, PBM, care management)
- Quarterly joint review meeting with agenda covering KPI performance, flagged cases, and data quality issues
- Annual contract review with procurement and legal to assess performance against SLAs and renegotiate terms
- Defined escalation path for SLA breaches (written notice, cure period, fee adjustment trigger)
Pro Tip: Negotiate PBM and TPA deliverables tied to specific, measurable reporting outputs, not narrative summaries. "Monthly line-level claims file delivered within 30 days of month-end" is enforceable. "Regular reporting on plan performance" is not.
How to measure impact: KPIs, reporting cadence, and attribution
Measurement is where most employer programs fall apart. Without a defined baseline and a consistent KPI set, you cannot distinguish program impact from natural population volatility.
Recommended KPI set:
- Share of total plan spend attributable to top 1% and top 5% of claimants (quarterly)
- Per-member-per-month (PMPM) cost trend, overall and for the high-cost segment
- Count of members above each threshold tier (monthly)
- Persistence rate: what percentage of last year's high-cost members are high-cost again this year
- Average claim size for the high-cost segment
- Case management engagement rate and gap-closure rate
- ER avoidance events attributed to case management outreach
Reporting cadence
Monthly operational reporting covers new flags, active case counts, and data quality issues. Quarterly strategic reporting covers KPI trends, vendor performance, and program ROI estimates. Annual benchmarking compares your PMPM trend and HCC concentration against industry benchmarks from sources like Mercer's national survey, which tracks rising cost intensity and the shift toward upstream clinical strategies.
| Metric | Definition | Reporting Frequency |
|---|---|---|
| HCC share of spend | % of total paid claims from members above $100K | Quarterly |
| PMPM trend | Total paid claims divided by member-months | Monthly |
| Persistence rate | % of prior-year HCCs who are HCC again | Annual |
| Engagement rate | % of flagged members who accepted case management | Monthly |
| Gap-closure rate | % of open care plan items resolved within 90 days | Quarterly |
Attribution guardrails: Set a 12-month baseline before the program launches. Adjust for member churn (members who leave the plan skew both baseline and outcome data). Use a comparison group or trend-adjusted model rather than a simple before/after comparison, which conflates program impact with regression to the mean. High-cost claimant populations are volatile year to year, so a single year of data is rarely sufficient to claim statistical significance.
How a population-health program reduces high-cost claimants: a client-case model
A well-structured population-health program addresses the HCC problem at every layer simultaneously: data integration, clinical intervention, pharmacy management, and vendor accountability.
The program model that delivers consistent results combines integrated case management (medical and pharmacy data feeding a single care manager view), nutrition and mental health services embedded in chronic disease protocols, site-of-care steering for infusions and elective procedures, and vendor data agreements that guarantee timely, line-level reporting.
On program ROI: Employers who implement targeted, integrated population-health programs with active case management and nutrition and behavioral health components report measurable reductions in high-cost claim frequency and total plan spend. Hadaco's employer programs have delivered an average savings of $451 per employee in the first year, with outcomes tracked through quarterly reporting so employers can see exactly where the savings are coming from.
How the measurement works:
- Engagement: Member outreach rate, program enrollment, and case manager touchpoint frequency
- Clinical outcomes: Gap-closure on chronic disease metrics (HbA1c, blood pressure, BMI), ER avoidance, medication adherence
- Financial outcomes: PMPM trend for enrolled members vs non-enrolled, reduction in HCC count, stop-loss claim frequency
The savings estimator at Hadaco lets you model the expected impact for your specific population before committing to a program.
What HR leaders consistently get wrong, and what to fix first
Most employers are not failing because they lack the right intentions. They are failing because of a small set of structural gaps that compound over time.
- No contractual data rights: The single most common gap. If your TPA or PBM contract does not explicitly grant you line-level data access with a defined SLA, you are operating blind. Fix this at the next renewal, or negotiate a mid-contract amendment now.
- Slow vendor SLAs: A 90-day claims lag means you are intervening on cases that resolved themselves or escalated past the intervention window. Thirty days is the maximum acceptable lag for operational case management.
- Treating specialty pharmacy separately from medical spend: Specialty drugs billed to the medical benefit are invisible to a PBM-only analytics view. You need integrated data or you will consistently undercount your true specialty drug exposure.
- Ignoring mental health comorbidity: A member with diabetes and untreated depression costs significantly more than a member with diabetes alone. If your case management protocol does not screen for behavioral health, it is missing a primary cost driver.
- No persistence analysis: If you do not track which high-cost members recur year over year, you cannot distinguish a program that is working from a population that naturally regressed.
- Siloed governance: Benefits, finance, clinical vendors, and legal are often working from different data sets and different priorities. A quarterly HCC governance meeting with all four stakeholders aligned on the same KPI dashboard is the fastest way to close that gap.
Pro Tip: Bring finance into the HCC governance conversation early. Show them the concentration data, not just the trend line.
Hadaco's employer program delivers the playbook, not just the plan
Employers who want to move from reactive cost management to a proactive, measurable program need more than a framework. They need a partner who integrates data, clinical services, and reporting into a single accountable structure.
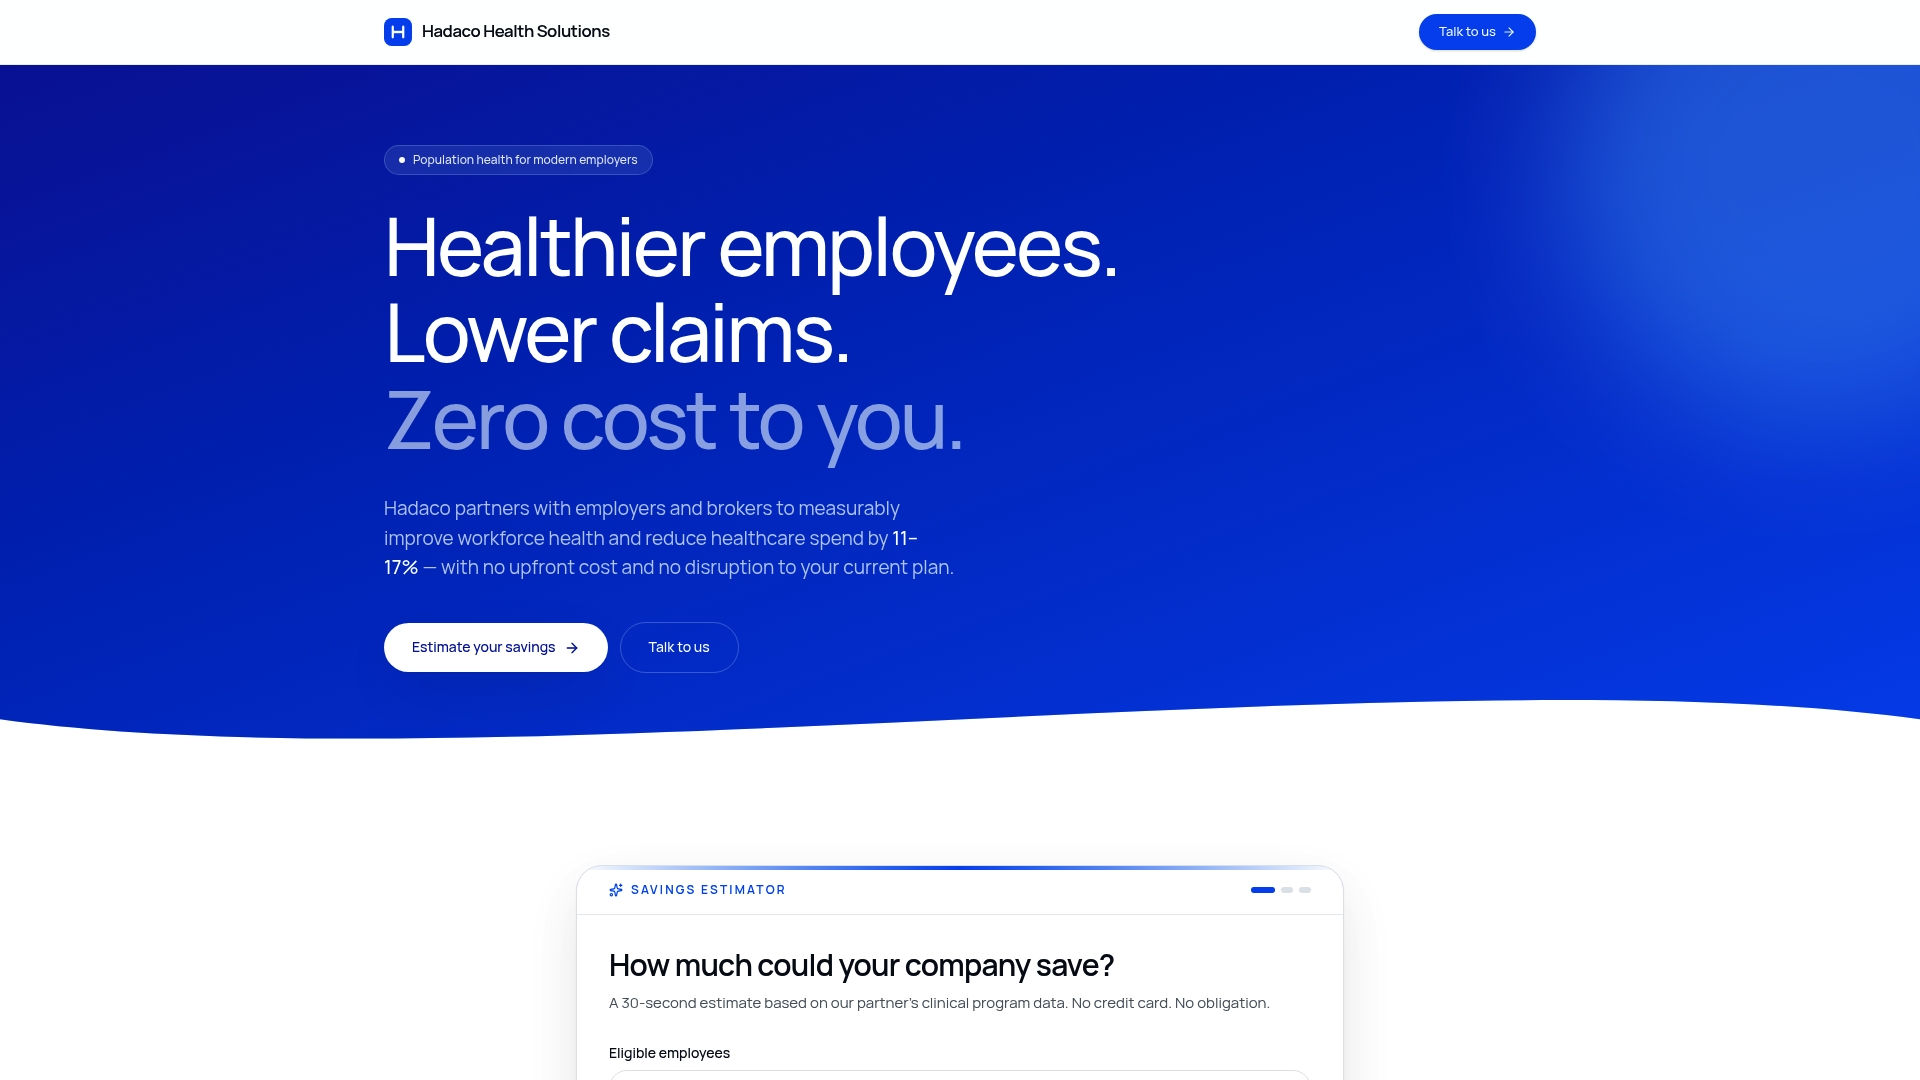
Hadaco's population-health programs implement every layer of this playbook: integrated medical and pharmacy data analysis, active case management, nutrition therapy, behavioral health support, site-of-care steering, and vendor data agreements, all without disrupting your existing benefit plan. There are no upfront fees. Employers in their first year see an average savings of $451 per employee, tracked through quarterly reporting that shows exactly which interventions are driving results.
The Hadaco savings estimator lets you model the expected impact for your population before you commit. Book a consultation to see what a targeted, evidence-based program looks like for your specific workforce and plan design.
Sources
- Rethinking How Employers Address High-Cost Claims
- High-Cost Claimant 2025 Report
- Mitigating the impact of high-cost claimants | MedInsight
- Managing High-Cost Claimants Is Employers' Top Health Savings Strategy
This article is general information, not a substitute for advice from a qualified financial advisor. Consult a qualified financial professional about your own circumstances before acting on anything here.