
Published research on workplace prevention mostly points to a positive return, but the size varies widely. Across studies, returns cluster around $2 to $3 for every dollar spent. Programs that run longer, reach more people and connect screening to follow-up care tend to do best. If you are a CFO, CHRO or benefits leader, the useful questions are what counts as a return, what range is realistic, and how to measure it without fooling yourself.
TL;DR
- A 2026 review of 112 studies found 89% reported a cost-benefit ratio above 1:1, with a median ROI of 1:3.1.
- Individual U.S. studies land closer to $2.03 to $2.53 per dollar, and returns grow the longer a program runs.
- "ROI" is not one standard formula, so define your method (costs, benefits, time frame, comparison group) before you launch.
- Screening alone rarely pays. Screening tied to a structured follow-up pathway is where the favorable economics show up.
- Track engagement, claims and retention together, and report them quarterly.
Table of Contents
- What preventive care ROI means for an employer
- What the evidence says about returns
- Why published ROI numbers differ so much
- How to calculate preventive care ROI fairly
- Making participation work alongside your current plans
- Where the savings come from: chronic disease
- See what a program could mean for your workforce
- FAQ
- Sources
What preventive care ROI means for an employer
In occupational health research, ROI is the financial benefit relative to the cost of the intervention. Benefits can include avoided wage costs from lower absenteeism and recovered productivity from lower presenteeism (being at work but working below capacity).
For an employer, the return usually shows up in four places:
- Medical and pharmacy claims. Fewer avoidable emergency visits, hospitalizations and late-stage diagnoses.
- Absence and disability days. Fewer days lost to illness and injury.
- Productivity. Less presenteeism, which is harder to measure but often drives the financial case.
- Retention and engagement. Lower turnover and the replacement costs that go with it.
The CDC's NIOSH points out that studies of comprehensive workplace health initiatives have shifted from return on investment toward value of investment. That framing adds participation rates, morale, turnover and injury risk to the dollar calculation. Treat both views as legitimate, and put them in the same report.
What the evidence says about returns
No single number settles the question, so here are the major findings side by side.
| Source | What it measured | Result |
|---|---|---|
| Llamas and Estévez, 2026 | 112 workplace prevention studies, 2003 to 2024 | 89% had a ratio above 1:1; median ROI 1:3.1 |
| Thonon et al., 2023 | 138 workplace prevention interventions | ROI positive for 56.5%, negative for 8.7%, neutral for 9.4%, undetermined for 25.4% |
| Baicker, Cutler and Song, 2010 | Meta-analysis of wellness programs | Medical costs fell about $3.27 and absenteeism costs about $2.73 per dollar spent |
| CDC-stacked cohort study | 3,829 participants vs. 6,617 controls, 2005 to 2011 | Monthly costs $35.1 lower for participants; ROI of $2.53 per dollar |
| Colorado health risk study | 2,458 workers at 121 businesses, one year | Simulated medical and productivity savings of $2.03 per $1 |
| Well at Dell | One large employer program, 2011 | Overall ROI of 2.48 |
| CDC Community Guide | Worksite health risk assessment with feedback, eight studies (2005 dollars) | Benefit-to-cost ratio from 1.4:1 to 4.6:1 |
Two other findings are worth knowing. The CDC reports that L.L. Bean's comprehensive well-being program returned between $1.70 and $5.30 per dollar invested. And a 2025 review of early disease detection in workplace programs found that early diabetes management cost $3,000 to $6,000 per patient up front but saved $14,000 to $30,000 over a lifetime. It also found that none of its studies judged early detection economically unfavorable on net.
A 2026 systematic review of 56 studies found healthcare-cost outcomes favorable in 21 of 29 studies and ROI favorable across all 20 studies that reported it. Absenteeism results were mixed, and presenteeism and turnover were rarely measured. A 2026 meta-analysis points the same way: the authors suggest ROI gains reflect presenteeism improvements rather than measured absence reductions. So build presenteeism and engagement into your measurement plan, because that is where much of the value may sit.
Why published ROI numbers differ so much
The spread from $0.26 to $5.30 per dollar is not noise. It comes from identifiable design choices, and those choices are the ones you control.
Program length
A 2021 scoping review of 47 articles found a positive relationship between ROI and program length. The 2026 review of 112 studies found the same pattern, with ROI rising as programs ran longer. Prevention pays back over years, so a twelve-month window is a first checkpoint, not the final verdict.
Company size
The same scoping review found that evaluations in companies with 500 or fewer employees produced lower ROI estimates than those in larger companies. Scale spreads fixed costs across more people. If you are mid-sized, set your expectations with that in mind.
Who ran the evaluation
The review also linked conflict of interest to higher ROI estimates, and higher methodological quality to lower ones. This is why independent measurement and a comparison group matter. A vendor-reported number is a starting point. Your own claims data, analyzed against a baseline, is the number your CFO will trust.
Leadership and priority
RAND's review of a pharmaceutical company's prevention program, which reported returns between $0.26 and $2.12, named commitment from senior leadership and making health an organizational priority as key success factors. Programs treated as a side perk tend to get side-perk results.
Screening connected to care
The 2026 BMC review found favorable economics for workplace blood-based screening almost only where it was tied to a structured, coordinator- or physician-led pathway. Its authors suggest the value lies less in the test than in the support that turns a result into sustained behavior or a treatment change. The practical lesson: buy the pathway, not just the screening event.
If you want a broader look at how program design affects outcomes, this overview of designing workplace wellness programs covers the research on whether such programs reduce medical costs and healthcare use.
How to calculate preventive care ROI fairly
The 2023 systematic review is blunt on this point: ROI is not a defined indicator but a notion calculated in different ways, including benefit-cost ratio, net present value and profitability index. The diversity of methods makes studies hard to compare. Your internal calculation will be credible only if you fix the method in advance.
Step 1: Set the formula
The simplest version is (program benefits minus program costs) divided by program costs. Decide now whether benefits include only claims savings or also absence and productivity. Write it down, and use the same version every quarter.
Step 2: Pick a baseline and a comparison
Compare against your own pre-program claims trend, and where possible against a comparison group of non-participants or unaffected populations. Participants who sign up are often healthier or more motivated to begin with, so raw participant-versus-nonparticipant gaps can overstate results. This is the main reason higher-quality studies report lower ROI.
Step 3: Count all the costs
Include fees, internal staff time, communications, incentives and any screening costs. Leaving these out is the fastest way to produce a number that collapses under scrutiny.
Step 4: Track leading and lagging indicators
Claims take time to move. In the meantime, watch metrics that predict them:
- Preventive visit and screening completion rates
- Enrollment and sustained engagement in chronic condition programs
- Behavioral health utilization
- Telehealth use
- Absence and disability days
- Voluntary turnover
Step 5: Report on a schedule
Quarterly reporting keeps the program accountable and shows trends before the annual renewal conversation. If you also want a framework for HR audiences, see our guide to corporate wellness ROI for HR leaders.
A worked example
Suppose a program costs $400,000 in a year, and your analysis attributes $1,000,000 in avoided claims, absence and productivity gains to it. The ROI is ($1,000,000 minus $400,000) divided by $400,000, or 1.5, which is $2.50 returned per dollar spent. That sits inside the range the research reports. The figures are illustrative, not a forecast. The discipline is in where the $1,000,000 comes from: documented, comparison-adjusted and agreed with finance before the program starts.

Making participation work alongside your current plans
Returns depend on people using the program. A few practical principles keep it simple for employees and low-friction for HR:
- Build on the benefits you already have. Most medical plans cover recommended preventive services, so the program should point employees to that coverage and fill gaps, not replace plans or add new enrollment steps.
- Lower the effort to start. Offer screenings and coaching through channels employees already use, and make the next step after an abnormal result obvious.
- Close the loop. A result with no follow-up wastes the screening spend. Assign a coordinator or clinical pathway to every flagged risk.
- Make leaders visible. The RAND finding on leadership commitment applies to communication as much as budget.
For more on getting the design right, our practical guide to evidence-based wellness programs walks through the building blocks, and our look at the common myths addresses the objections finance teams raise most often.
Where the savings come from: chronic disease
Chronic conditions are where prevention and cost control meet. Catching prediabetes, hypertension or respiratory disease early and keeping people engaged in care avoids expensive complications later. The 2025 early-detection review put COPD case-finding at 35 to 45% lower annual per-patient costs and found the diabetes lifetime savings cited above. That is why a population health approach focuses on risk stratification and follow-through rather than one-off events. Our piece on cutting workplace chronic disease costs goes deeper on that approach.
Our perspective
We built Hadaco around one belief: an employer should not have to choose between taking care of people and taking care of the budget. The research is clear that returns come from design: evidence-based interventions, continuity over years, and a pathway from detection to care. That is how we build programs for chronic disease, preventive care, mental health and engagement.
We also think the burden of proof belongs on the program. That is why we offer a transparent savings estimator and quarterly outcome reporting, and why our programs come with no upfront fees. Our service fees depend on demonstrated savings and engagement outcomes, so our incentives match yours.
Our programs are designed to complement your existing benefit plans rather than disrupt them. In their first year, companies often see average savings of $451 per employee, along with better engagement and retention. We want you to see the numbers every quarter, not just at renewal.
Gene
See what a program could mean for your workforce
Hadaco's population health programs bring evidence-based interventions for chronic disease, preventive care, mental health and engagement into the plans you already have. Our savings estimator gives you a transparent starting point, quarterly reporting shows what is changing, and there are no upfront fees. We work with both employers and the brokers who advise them.
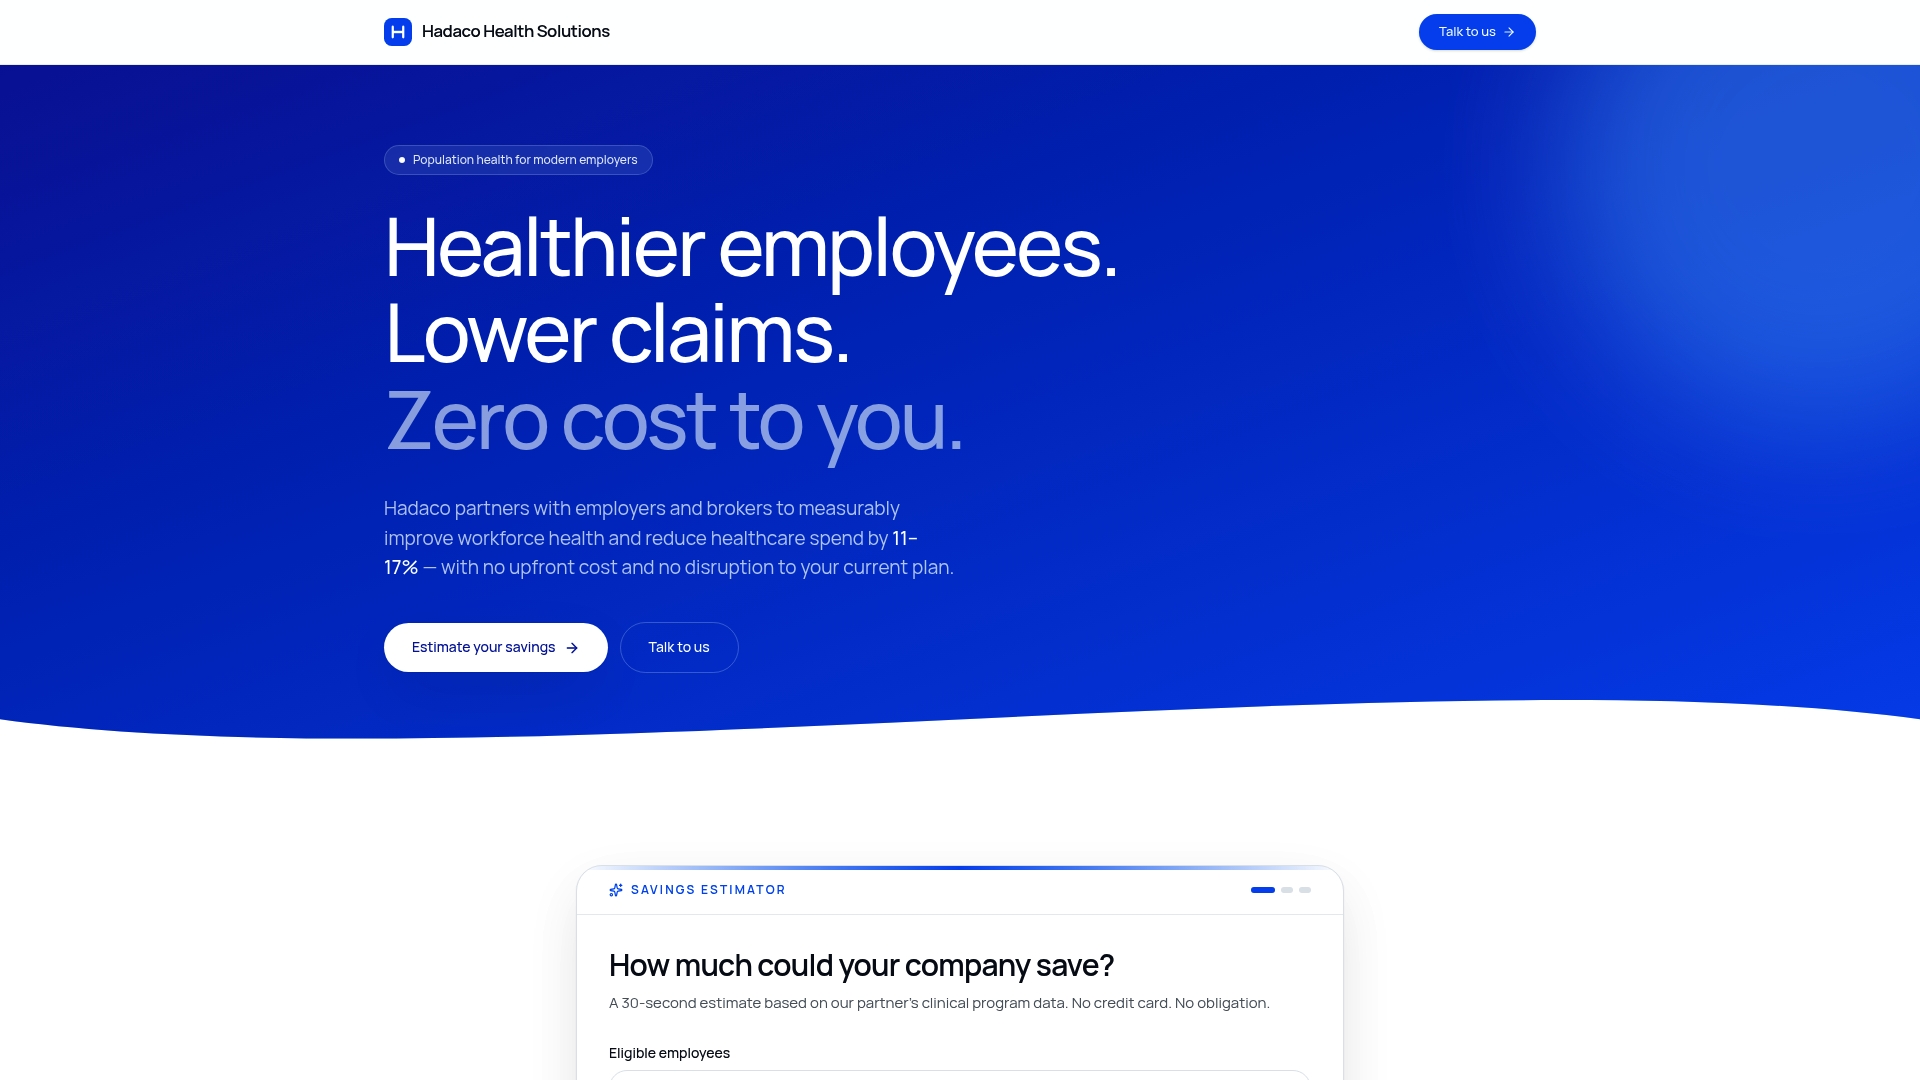
To see how it could apply to your organization, explore Hadaco's population health program and book a consultation. If you are weighing funding models first, our comparison of self-funded and fully insured wellness is a good place to start.
FAQ
What is a realistic ROI for preventive care at work?
Most U.S. studies report between about $2 and $3 returned per dollar, and a 2026 review of 112 studies found a median of 1:3.1. Individual programs range widely depending on design, duration and company size. Set a target range with your finance team and revisit it after the first full year of data.
How long before a preventive care program pays off?
Research shows ROI tends to rise with program length, so expect the picture to improve over multiple years. Leading indicators such as screening completion and program engagement move first, and claims follow. Use quarterly reporting to see the early signals while the financial return builds.
Does preventive care ROI include productivity, or only claims?
It can include both. Researchers define the benefits as avoided wage costs from reduced absenteeism and recovered productivity from reduced presenteeism, in addition to healthcare cost savings. Decide up front which categories you will count so results stay comparable quarter to quarter.
Will a preventive care program disrupt our current benefits?
It does not have to. Hadaco's programs are designed to complement existing benefit plans, so employees keep their current coverage and gain added support for chronic disease, prevention and engagement. Your benefits team keeps its current carrier and plan structure.
Sources
- Occupational health interventions' impact on absenteeism (PMC, 2026)
- Making the Business Case, Total Worker Health (CDC)
- Return on investment in workplace health prevention (BMC Public Health, 2026)
- Return on investment of workplace-based prevention (PMC, 2023)
- Workplace Wellness Programs Can Generate Savings (Health Affairs, 2010)
- Impacts of Workplace Health Promotion and Wellness (CDC Stacks)
- Estimating the Return on Investment From a Health Risk Management Program (PMC)
- An Evaluation of the Well at Dell Health Management Program (PubMed)
- Assessment of Health Risks with Feedback (CDC Community Guide)
- Economic Impact of Early Disease Detection in Workplace Programs (2025 review)
- Economic and productivity outcomes of workplace health programs (BMC Health Services Research, 2026)
- A Scoping Review of Economic Evaluations of Workplace Wellness (PMC, 2021)
- The return of investment for preventive healthcare (RAND, 2017)
- Establishing and Designing Wellness Programs at Work