
Mental health outcomes measurement must give HR and finance a quarterly, population-level view that links engagement to PMPM and a net ROI estimate. Employers are moving away from participation counts and toward dashboards that connect screening, utilization, and claims data, a shift reflected in the 2026 well-being strategy survey from Business Group on Health. That cadence turns a wellness vendor relationship into a line item CFOs can actually evaluate.
TL;DR:
- Most employer measurement relies on combining leading indicators like screening and engagement rates with lagging indicators such as claims and absenteeism to accurately assess program impact.
- Linking multiple data sources, including claims, EAP logs, HRIS data, and survey results, requires early planning, clear data-sharing agreements, and alignment of reporting windows for credibility.
- Valid attribution of outcomes depends on designs like difference-in-differences or matched cohort analysis to control for biases such as selection bias and regression to the mean.
- Quarterly dashboards should focus on core KPIs like PMPM spend, engagement, and ROI multiple, with clear attribution, sample sizes, and confidence intervals for each metric.
- Measuring success is only meaningful if it informs program adjustments, such as prioritizing high-risk cohorts or testing targeted interventions that focus on those with the highest potential for cost savings.
Table of Contents
- The metrics employers actually need to track
- Pulling the data together without creating a mess
- Proving the program caused the result, not just correlated with it
- Building a quarterly dashboard leadership will actually read
- Turning measurement into lower costs
- The standardized scales behind the numbers
- Where the numbers get shaky
- Protecting employees while you measure them
- Tracking the same cohort over years, not quarters
- Numbers alone do not tell the whole story
- What I'd demand before signing anything
- How Hadaco fits into your measurement plan
- Sources
- FAQ
The metrics employers actually need to track
Good measurement rests on two kinds of numbers: signals that predict outcomes and signals that confirm them. Mixing both is what NIOSH recommends in its Total Worker Health metrics guidance, which advises combining leading indicators like policy adoption and engagement with lagging indicators like claims and absenteeism rather than relying on a single short survey.
Leading indicators tell you whether people are finding and using the program:
- Screening prevalence, measured through validated instruments such as the WellBQ or a brief depression and anxiety screener offered at enrollment.
- Program enrollment and ongoing engagement rate, tracked monthly rather than as a single snapshot.
- Referral counts from primary care, EAP, or manager-initiated channels into the program.
Lagging indicators confirm whether engagement turned into results:
- Behavioral health and total medical PMPM spend, tracked against a pre-program baseline.
- EAP utilization and behavioral-health-specific claims volume.
- Absenteeism days and presenteeism or productivity estimates, converted to a per-employee-per-year (PEPY) dollar figure using standard wage-weighted methods.
Participation alone tells you nothing about cost or clinical impact. A program with high sign-up and flat claims trend has not moved the number that matters to finance, so every leading indicator in your dashboard needs a lagging partner it is supposed to predict.
Pulling the data together without creating a mess
A credible population-level picture draws on several systems that were never built to talk to each other. The practical path is to decide early which fields you need from each and how they will connect.
- Pull medical and pharmacy claims for behavioral health diagnosis and treatment codes, plus total medical spend for the same members.
- Add EAP utilization logs, which usually sit outside the medical claims feed and need a separate data-sharing agreement.
- Bring in HRIS absence and payroll data to calculate absenteeism days and wage-weighted productivity loss.
- Layer in engagement or clinical platform event data: logins, completed modules, screener scores over time.
- Where available, add workplace survey data using a validated tool like the WellBQ to capture self-reported well-being alongside the claims picture.
Linking these sources usually relies on hashed member IDs or a contracted data-sharing point rather than names or Social Security numbers. Align the data on consistent windows, typically a 12-month pre/post comparison or rolling 90 to 180-day windows for faster-cycle programs, and sync reporting cadence so claims, which often lag by 60 to 90 days, do not get compared against this month's engagement numbers.
Privacy and contracting matter as much as the analytics. A data-use agreement should specify what is shared, how long it is retained, and who can see individual-level data versus aggregated reports. HIPAA considerations apply whenever protected health information changes hands, and any vendor should be able to describe its security posture in plain terms before a contract is signed.
Pro Tip: Ask any vendor for a sample de-identified report before signing, not after the first quarter closes.

Proving the program caused the result, not just correlated with it
Showing that claims went down after a program launched is not the same as showing the program caused it. Credible attribution uses one of two designs. Difference-in-differences compares the change in outcomes for enrolled members against the change for a similar unenrolled group over the same period, which controls for broader trend shifts like inflation or a bad flu season. Matched cohort analysis pairs enrolled members with similar non-enrolled members on age, risk score, and prior utilization, then tracks both groups forward.
Risk stratification, using claims-based risk scores, identifies which cohorts carry the highest cost and clinical burden, so analysis and outreach can concentrate where the dollar impact is largest rather than spreading thin across a whole population.
Watch for two recurring biases: selection bias, where the people who enroll were already healthier or more motivated than non-enrollees, and regression to the mean, where high-cost members naturally trend toward average cost regardless of any intervention. A defensible report states confidence intervals and flags heterogeneity across subgroups instead of presenting one clean number.
A pooled analysis of employer behavioral health programs across 19 employers and 42,148 participants found a pooled ROI multiple of 2.3, with a 95% confidence interval of 1.9 to 2.8, and average net savings near 14.3%, according to a meta-analysis published in PMC. That range, not a single headline figure, is what a rigorous vendor report should show.

Expect quarterly reports to include PMPM change, an ROI multiple, and net savings per participant, each with its confidence range rather than a bare point estimate.
Building a quarterly dashboard leadership will actually read
A dashboard earns its place on a CFO's desk when it answers one question fast: did this spend translate into savings? The core KPI set includes engagement rate, screening prevalence, PMPM for behavioral and total medical spend, net savings, an ROI multiple, and dollar-converted absenteeism and presenteeism offsets.
- Cohort trend lines showing PMPM for enrolled versus matched non-enrolled members over four to six quarters.
- A funnel view moving from engagement to utilization to outcome, which shows where members drop off before reaching a clinical result.
- An ROI waterfall breaking net savings into claims reduction, absenteeism offset, and productivity gain.
Different stakeholders read different rows of the same report. A CFO wants the ROI multiple and net savings total first. A CHRO wants engagement and retention signals. A broker wants a packet clean enough to hand to a renewal committee without edits.
A defensible reporting package includes raw PMPM figures, the attribution model used, sample sizes, and confidence intervals, tied to a dashboard that links the engagement funnel to outcomes.
Business Group on Health, 2026 Employer Well-being Strategy Survey
Set governance triggers in advance: a cohort missing its projected ROI by a defined margin for two consecutive quarters should prompt a program review, not a quiet renewal. For a deeper look at what a quarterly packet should contain, see U.S. HR leaders: 3 KPIs quarterly wellness reporting must include.
Turning measurement into lower costs
Measurement only pays for itself when it changes what the program does next.
- Use claims-based risk stratification to prioritize outreach toward the highest-cost, highest-risk cohorts rather than broadcasting generically to the whole population.
- Pilot a targeted intervention, such as rapid-access counseling for a high-risk group, and report that cohort's outcomes separately each quarter instead of blending it into the overall average.
- Reinvest measured savings into the program elements showing the strongest return, and reconsider or retire the ones that are not moving PMPM or absenteeism.
Pro Tip: Treat every pilot as its own small study: define the cohort, the comparison group, and the metric before launch, not after the results come in.
A retrospective cohort study of a rapid-access behavioral health program found a net PMPM reduction of $164, equating to roughly $1,070 in savings per participant in the first year, with an ROI of 1.9x, according to research published on PubMed. Treat figures like this as a range to expect, not a guarantee: results vary by population risk profile, baseline utilization, and program design, and the pooled analysis above shows that variability explicitly through its confidence interval.
The standardized scales behind the numbers
Population-level dashboards are built on individual-level instruments, and knowing what those instruments measure helps you interpret the aggregate numbers correctly. The PHQ-9 screens for depression severity through nine self-reported items and is widely used as an intake and progress-tracking tool. The GAD-7 does the same for generalized anxiety with seven items. The WHODAS measures functional disability across domains like work, self-care, and social participation, which makes it useful for connecting mental health status to productivity and absenteeism rather than symptoms alone.
For employer reporting, what matters is prevalence and change over time at the population level: what share of screened employees fall into a moderate-or-higher severity band, and how that share shifts after a program launches, not individual scores. The CDC Worksite Health ScoreCard includes a depression and stress management module employers can use to benchmark their own screening and intervention practices against an evidence-weighted standard. A vendor that cannot say which screener it uses, or whether it is validated, is not giving you a number you can trust quarter over quarter.
Where the numbers get shaky
Even a well-built measurement program runs into real limits. Self-reported screeners capture a moment in time and can shift with seasonal stress, workload spikes, or simple survey fatigue, so a single quarter's prevalence number is noisier than a trend line across several quarters.
Claims data lag by 60 to 90 days in most systems, which means the PMPM figure in a given quarterly report often reflects care delivered two quarters earlier. Comparing that lagged figure against this quarter's engagement rate can make a program look less effective than it is, or mask a real improvement.
Small employee populations, particularly under a few thousand covered lives, generate wide confidence intervals around any ROI estimate, which is exactly why the pooled meta-analysis cited earlier reports a range of 1.9 to 2.8 rather than a single multiple. A single-employer result sitting outside that range is not necessarily wrong, but it deserves scrutiny before it goes into a board deck.
Finally, participation is not random. People who enroll in a mental health program often differ systematically from those who do not, whether in motivation, baseline health, or access to time off to attend sessions. Matched-cohort and difference-in-differences designs exist specifically to correct for that gap, but no method eliminates it entirely.
Protecting employees while you measure them
Mental health data carries more stigma risk than most other categories of workforce data, which raises the bar for how it is collected, stored, and reported. Aggregate reporting, never individual-level disclosure to managers or HR business partners, should be the default for any dashboard built from claims or screening data.
Data-use agreements need to specify retention periods, who can access raw versus aggregated data, and what happens to the data if a vendor relationship ends. HIPAA governs protected health information whenever it changes hands between a health plan, a vendor, and an employer, and any reporting pipeline touching claims or clinical data should be built with that framework in mind from the start, not retrofitted after a near-miss.
Consent matters beyond the legal minimum. Employees are more likely to engage honestly with screening tools when they understand, in plain language, what is measured, who sees it, and that individual answers will not reach a supervisor. The WHO guidelines on mental health at work point to organizational-level interventions like manager training as high-impact levers, and those interventions depend on employees trusting the measurement process enough to participate honestly in the first place.
Tracking the same cohort over years, not quarters
A single pre/post comparison can be misleading if it happens to land during an unusually good or bad period. Longitudinal tracking, following the same cohort across multiple years, smooths out that noise and reveals whether gains are holding.
The practical discipline is keeping a consistent member cohort definition across reporting periods, so a member who leaves and rejoins, or who moves between risk tiers, does not quietly skew the trend line. Rolling 90 to 180-day windows work well for faster-moving engagement metrics, while PMPM and absenteeism are better tracked on 12-month pre/post windows that absorb seasonal variation.
Longitudinal cohort data on workplace health promotion programs, tracked over a multi-year period, has been associated with reduced healthcare utilization and positive returns, according to a retrospective seven-year cohort analysis from CDC. The lesson for employers is patience: a program that shows a modest result in year one may show a stronger one by year three, provided the measurement framework stays consistent enough to compare the two.
Numbers alone do not tell the whole story
Claims and screener scores answer whether something changed. They rarely answer why. Pairing quantitative metrics with patient-reported outcomes and qualitative feedback, such as open-text survey responses, exit interviews with employees who disengaged from a program, or structured focus groups, fills that gap.
A funnel showing a steep drop-off between screening and program enrollment tells you something broke, but not what. A handful of qualitative interviews with employees who screened positive but never enrolled might reveal a scheduling barrier, a stigma concern, or confusion about cost, each of which calls for a different fix. Illustrative pilot write-ups, like the short case study on a brief workplace reset intervention from U4RIA, show how pairing a quantitative result with a qualitative description of what the pilot actually involved makes the number easier for leadership to interpret and act on.
Build a small qualitative component into every quarterly cycle: a short open-ended question on the engagement survey, or a handful of structured check-ins with program dropouts. It costs little and routinely explains the gap between what the dashboard shows and what actually happened on the ground.
What I'd demand before signing anything
If you're building or buying a measurement-capable program, insist on a transparent savings estimator, quarterly multi-source reporting, sample cohort analyses before you sign, a clear data-use agreement, and proof-of-concept results from a comparable employer population. Anything less leaves you're guessing at renewal time.
— Gene
How Hadaco fits into your measurement plan
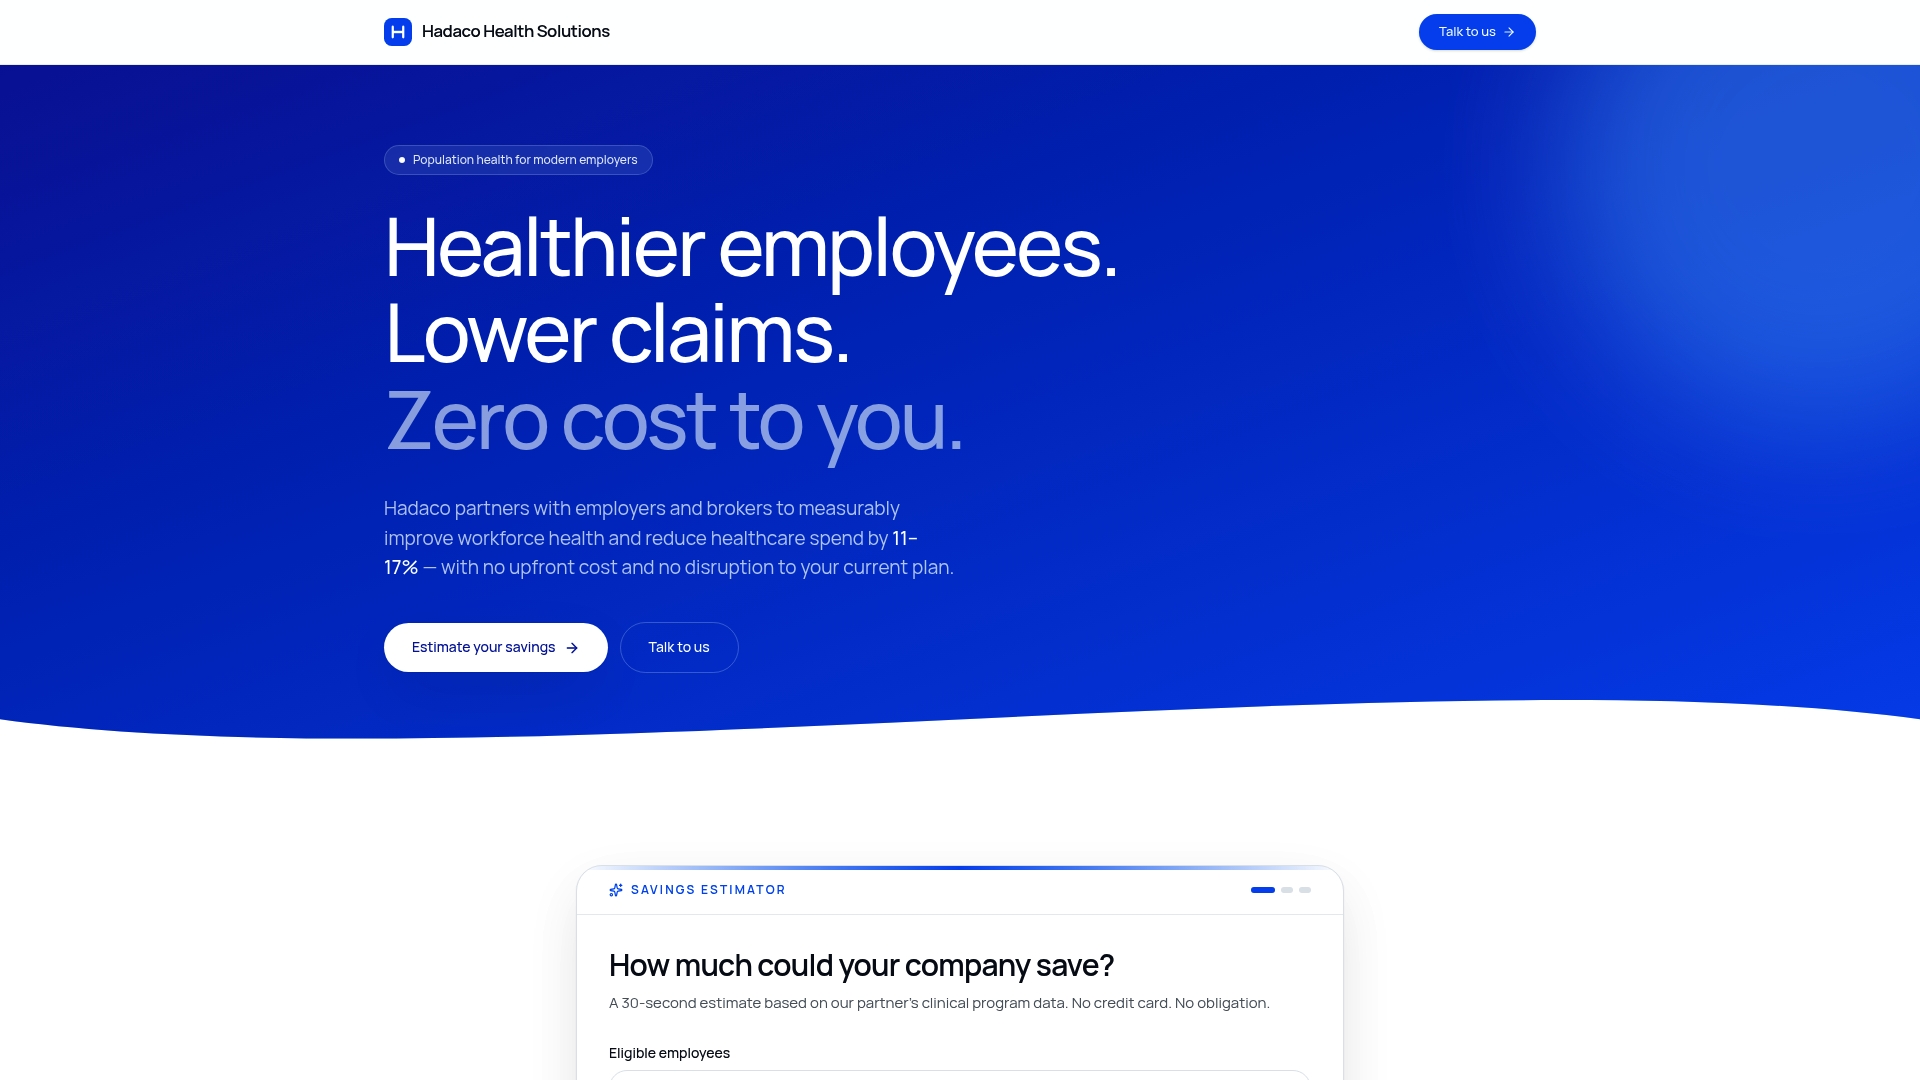
Hadaco builds population health programs around the same accountability standard this guide describes: a transparent savings estimator so you can see projected impact before you commit, and quarterly reporting once the program is live, with no upfront fees. The programs complement your existing benefit plans rather than replacing them, addressing chronic disease, preventive care, and employee engagement alongside mental health, so you are not standing up a parallel system.
- No upfront fees, with fees contingent on demonstrated outcomes.
- A transparent savings estimator you can review before signing anything.
- Quarterly reporting that tracks engagement alongside cost outcomes.
- Companies often see an average first-year savings per employee, alongside improved engagement and retention, according to reported results.
If your current reporting cannot answer the questions this guide raises, try the Hadaco savings estimator or book a consultation to see what a quarterly, ROI-linked report could look like for your population.
This article is general information, not a substitute for advice from a qualified doctor. Consult a qualified healthcare professional about your own circumstances before acting on anything here.
Sources
- 2026 Employer Well-being Strategy Survey: Executive Summary | Business Group on Health
- Total Worker Health® Metrics
- Meta-analysis showing employer-level ROI for behavioral health programs | PMC
- Cohort study showing PMPM savings and ROI for an employer-sponsored behavioral health program | PubMed
- CDC Worksite Health ScoreCard manual (Updated Feb 2025)
FAQ
What does mental health outcomes measurement actually track?
It tracks population-level indicators like screening prevalence, program engagement, behavioral and total PMPM spend, absenteeism, and presenteeism, reported on a regular cadence rather than as a one-time snapshot. A credible report links these leading and lagging indicators together rather than presenting them separately.
How often should employers get outcomes reports from a vendor?
Quarterly reporting is the standard employers now expect, according to Business Group on Health's 2026 survey, which ties well-being outcomes directly to medical trend and retention metrics. Reports built on this cadence let HR and finance catch problems before a full-year renewal decision.
What ROI can employers realistically expect from mental health programs?
A pooled analysis of 19 employer programs found an ROI multiple of 2.3, with a confidence range of 1.9 to 2.8, according to research published in PMC.
Which screening tools should employers ask vendors about?
The PHQ-9 and GAD-7 are widely used validated screeners for depression and anxiety severity, while the WHODAS measures functional disability tied to work and daily activities. A vendor should be able to name which validated instrument it uses and how prevalence is tracked over time.
How does Hadaco report outcomes to employers?
Hadaco provides a transparent savings estimator before enrollment and quarterly reporting once a program is active, with no upfront fees required. Reported first-year results show net savings per participant that vary depending on program design and population risk, alongside improved engagement and retention.