
Population health analytics identifies who in your covered population needs care now and what intervention will move outcomes and costs. At its core, it combines clinical, claims, and social determinants data to stratify risk, close care gaps, and prioritize outreach before a condition escalates into an expensive event. Validated frameworks like the Johns Hopkins ACG System have been tested across roughly two dozen countries and backed by more than 1,000 academic publications, giving healthcare leaders a proven foundation for risk scoring. Quality benchmarks like HEDIS and STARS translate that risk intelligence into measurable performance, and CMS value-based programs tie both to real financial consequences.
Employers who deploy these programs see tangible results. Hadaco reports an average savings of $451 per employee in the first year, with no upfront fees and quarterly reporting so HR and finance teams can track every dollar.
Core uses of population health analytics:
- Risk stratification: Segment your population by clinical complexity and predicted cost
- Care-gap closure: Identify members overdue for preventive screenings or chronic disease follow-up
- SDOH-driven outreach: Flag social barriers like housing instability or food insecurity that drive utilization
- Performance reporting: Track HEDIS/STARS measures, utilization trends, and contract performance
Pro Tip: Before you buy a predictive model, build your data foundation. A clean, unified patient record will deliver more value than a sophisticated algorithm running on fragmented inputs.
Table of Contents
- What core capabilities should a population health analytics platform include?
- What data inputs and technical capabilities power reliable analytics?
- How do analytics actually work: from descriptive to prescriptive?
- What outcomes does population health analytics deliver for value-based care?
- How do you implement population health analytics without derailing your team?
- How should you evaluate and choose a population health analytics solution?
- What challenges should you plan for, and how do you mitigate them?
- Hadaco in practice: what employer outcomes look like
- Key Takeaways
- The technology is the easy part
- Hadaco gives employers measurable results without upfront risk
- Selected sources and further reading
What core capabilities should a population health analytics platform include?
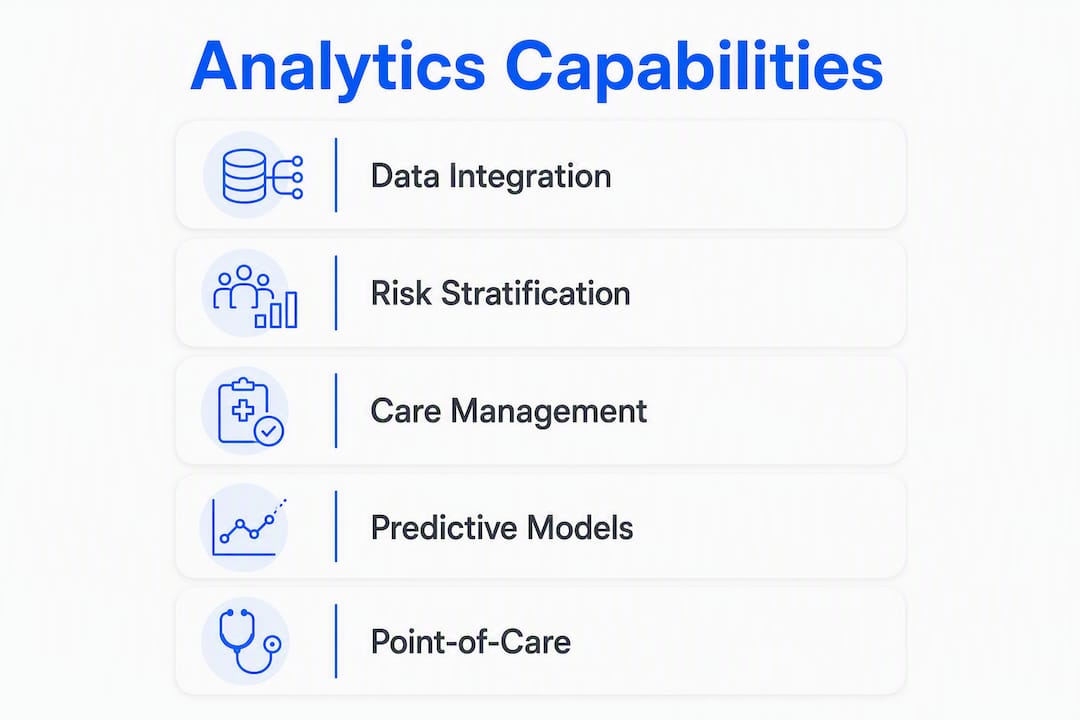
The gap between platforms that look impressive in a demo and ones that actually change clinical behavior comes down to a handful of capabilities. Here is what to require.
Essential platform capabilities:
- Unified patient index (master patient index): Links records across EHRs, claims, labs, and pharmacy to create one longitudinal view per person
- Risk stratification engine: Scores members by predicted cost, complexity, or disease burden using validated models
- Predictive and prescriptive modeling: Moves beyond "who is sick" to "who will deteriorate" and "what should happen next"
- SDOH enrichment: Appends social determinants data to clinical profiles so outreach addresses root causes
- Care management workflows: Assigns high-risk members to care managers, tracks interventions, and closes the loop
- Reporting and benchmarking: Measures HEDIS/STARS gaps, utilization trends, and contract performance against peers
- EHR embedding and point-of-care delivery: Surfaces alerts and care gap reminders inside the clinician's existing workflow
The last capability on that list is the one most platforms underdeliver. Embedding analytics into the point-of-care workflow is a critical adoption driver; standalone dashboards that require a separate login rarely change clinician behavior.
| Capability | What it enables |
|---|---|
| Master patient index | Accurate, deduplicated population view across data sources |
| Risk stratification | Targeted outreach; care management prioritization |
| Predictive modeling | Early identification of members likely to deteriorate |
| SDOH enrichment | Equity-focused interventions; reduced avoidable utilization |
| EHR embedding | Clinician adoption; real-time care gap closure |
| Reporting and benchmarking | HEDIS/STARS performance tracking; contract management |
What data inputs and technical capabilities power reliable analytics?
The quality of your analytics output is a direct function of your data inputs. Fragmented or stale data produces risk scores that clinicians distrust and care managers ignore.
Required data sources:
- EHR/clinical data (diagnoses, procedures, vitals, notes)
- Medical and pharmacy claims
- Lab results
- Enrollment and eligibility files
- SDOH data (housing, transportation, food insecurity)
- Outreach and engagement logs
- Device-generated data where available (remote monitoring, wearables)
On the technical side, you need a master patient index with deterministic and probabilistic matching to link records across sources without creating duplicate patients. Data normalization matters just as much: clinical terms must map to standard terminologies like SNOMED CT, LOINC, ICD-10, and RxNorm before any model can run reliably. ETL/ELT pipelines feed a curated data warehouse or data lake, and APIs connect the analytics layer back to EHR systems for point-of-care delivery.
Successful programs normalize clinical, claims, and SDOH data into a single longitudinal patient record before attempting predictive modeling. Organizations that skip this step end up with expensive models sitting on unreliable data.

Data quality checks to enforce before modeling: completeness (are all members represented?), timeliness (are claims feeds current within 30–60 days?), and terminology mapping (are diagnoses coded consistently across sources?).
Pro Tip: Start with one complete longitudinal record per member and iterate. Buying advanced ML models before your data foundation is sound is the single most common and costly mistake in population health programs.
How do analytics actually work: from descriptive to prescriptive?
The analytic progression is straightforward in concept and genuinely hard to execute well. Descriptive analytics shows what happened in your population. Predictive analytics estimates who will need care. Prescriptive analytics recommends the specific next action for each person.
Most organizations start at the descriptive level and stall there. The shift to predictive and prescriptive requires integrated, high-quality data across clinical, claims, and social determinants sources, which is why the data foundation work in the previous section is not optional.
Common analytic methods:
- Cohorting and segmentation: Group members by condition, risk tier, or care gap status for targeted programs
- Rule-based risk scores: Apply clinical logic (e.g., HbA1c > 9 + two or more comorbidities) to flag high-risk members
- Regression models: Estimate future cost or utilization based on historical patterns
- Survival and time-to-event models: Predict when a member is likely to experience a clinical event
- Ensemble ML models: Combine multiple algorithms to improve accuracy across heterogeneous populations
- Natural language processing (NLP): Extract diagnoses, medications, and social risk factors from unstructured clinical notes
The Johns Hopkins ACG System is one of the most recognized risk-stratification methodologies in use today. Developed at the Johns Hopkins Bloomberg School of Public Health, it categorizes combinations of diagnoses and medications to produce a morbidity burden score for each patient. Its validation across more than 1,000 peer-reviewed publications makes it a useful reference point when evaluating any vendor's risk model.
Predictive models are only as trustworthy as the data and governance behind them. Common failure modes include data bias (underrepresentation of certain subgroups), class imbalance (rare events are hard to predict), and concept drift (model performance degrades as population characteristics change). Plan for ongoing validation from day one, not as an afterthought.
Practical limits matter here. A model that performs well on average can perform poorly for specific subgroups, particularly when SDOH data is sparse. Fairness audits by race, age, and geography should be part of any model governance plan.
What outcomes does population health analytics deliver for value-based care?
The business case for health data analysis rests on a clear chain: better risk stratification leads to targeted case management, which reduces avoidable utilization, which improves both quality scores and financial performance.

| Analytics feature | Outcome | Measurement window |
|---|---|---|
| Risk stratification + care management | Reduced ED visits and hospitalizations | 30–60 days |
| Care-gap closure programs | Improved HEDIS/STARS scores | Annual measurement period |
| SDOH-targeted outreach | Reduced avoidable readmissions | 30 days post-discharge |
| Chronic disease management | Lower per-member-per-month cost | — |
| Employer wellness integration | Improved engagement and retention | Annual |
For employers specifically, population health analytics supports segmenting populations, identifying care gaps, and prioritizing targeted interventions that align with existing benefits and wellness programs. The ROI goes beyond raw claims savings. Engagement rates, retention improvements, and clinical outcomes like HbA1c control or blood pressure normalization all belong in the measurement set.
Hadaco's employer programs demonstrate what this looks like in practice: an average savings of $451 per employee in the first year, tracked through quarterly reporting that gives HR and finance teams a clear view of what is working.
First-year KPIs worth tracking: cost per employee (claims), gap-closure rate for prioritized HEDIS/STARS measures, outreach engagement rate, and changes in ED utilization or readmission rates.
How do you implement population health analytics without derailing your team?
Implementation fails most often not because of technology but because of workflow friction and change management gaps. A phased approach reduces both.
High-level implementation timeline:
- Discovery and data mapping (6–12 weeks): Audit data sources, assess quality, define use cases, and align clinical and operational stakeholders
- Data normalization and index build (3–6 months): Build the master patient index, normalize terminology, establish ETL pipelines, and validate the longitudinal record
- Pilot predictive models and workflows (3–6 months): Deploy risk stratification and care management workflows with a defined clinical cohort; measure adoption and outcomes
- Scale and continuous improvement (ongoing): Expand to additional populations, refine models, and establish governance rhythms
Implementation task owners:
- IT/data operations: data pipelines, MPI, EHR integration, security
- Clinical leads: workflow design, alert logic, care management protocols
- Care managers: outreach execution, intervention documentation
- HR and benefits leaders: program alignment, engagement measurement
- Vendor partner: platform configuration, training, outcome reporting
Cost signals vary by contracting model. Subscription and per-member-per-month arrangements are common for platform access. Performance-based fee structures, where vendor compensation is tied to demonstrated savings, align incentives better for employer programs and reduce upfront financial risk.
Pro Tip: Start with a small, clinician-led pilot cohort. Measure both clinical outcomes (gap closure, utilization) and operational adoption (alert response rate, care plan completion). Clinicians who see the tool work in their own patients become your best internal advocates.
How should you evaluate and choose a population health analytics solution?
A structured buyer checklist prevents vendors from steering demos toward their strengths and away from your requirements.
Buyer checklist:
- Data integration: Can it ingest EHR, claims, labs, pharmacy, and SDOH from your specific sources?
- Master patient index: How does it handle duplicate records and cross-source matching?
- Risk model validation: Is the underlying methodology validated (e.g., ACG-based or peer-reviewed equivalent)?
- SDOH support: Does it append and act on social determinants data, not just display it?
- EHR embedding: Does it surface alerts inside your EHR workflow, or require a separate login?
- Care management workflows: Can care managers assign, track, and close interventions within the platform?
- Reporting and benchmarking: Does it produce HEDIS/STARS gap reports and benchmark against peer populations?
- Security and HIPAA compliance: What are the data use agreement terms, encryption standards, and audit trail capabilities?
- Scalability: Can it handle your full population and grow with your network?
- Support model: What does implementation support look like, and who owns outcomes accountability?
- ROI measurement: How does the vendor define and report savings, and how are results validated?
Comparison dimensions for vendor demos:
| Dimension | What to probe | Red flags |
|---|---|---|
| Risk stratification quality | Validation studies, subgroup performance | Vague "proprietary algorithm" claims with no published validation |
| Data sources and integration | Specific EHR connectors, claims feed latency | No SDOH support; manual data uploads only |
| Outcomes reporting | HEDIS/STARS gap reports, utilization trends | Dashboard-only; no workflow integration |
| Implementation timeline | Phased plan with milestones | "Go live in 30 days" without a data assessment |
| Security and governance | HIPAA BAA, role-based access, audit logs | No data lineage documentation |
| Pricing structure | Per-member-per-month vs. performance-based | All-or-nothing subscription with no outcome accountability |
Score vendors across four dimensions: clinical adoption potential, model performance evidence, implementation risk, and expected ROI. Weight clinical adoption highest. A technically superior model that clinicians ignore delivers nothing.
What challenges should you plan for, and how do you mitigate them?
Every population health program runs into the same set of obstacles. Knowing them in advance is the difference between a stalled pilot and a scaled program.
Top challenges and mitigations:
- Fragmented data: Establish a master patient index and data governance policy before launch; prioritize the two or three highest-value data sources first
- Poor data quality: Run completeness and timeliness audits on every feed; set automated quality thresholds that trigger alerts before bad data reaches the model
- Biased models: Run fairness audits by race, age, gender, and geography; if a subgroup is underrepresented in training data, supplement or adjust before deployment
- Alert fatigue: Surface only the top three actionable items per patient in the EHR view; suppress low-acuity alerts that clinicians consistently ignore
- Limited clinician time: Embed recommendations in existing workflows; reduce the number of clicks required to act on a care gap from five to one
- SDOH data gaps: Partner with community health organizations or use commercial SDOH data vendors to fill geographic gaps in social risk data
- Regulatory and privacy constraints: Maintain data use agreements for every source, enforce role-based access, and document data lineage for audit purposes
Governance basics that prevent downstream failures: monthly data operations reviews to catch feed issues early, quarterly model revalidation to detect concept drift, and an annual fairness audit across key subgroups.
Pro Tip: Prioritize SDOH enrichment early. Programs that skip social determinants data often optimize for the average member and miss the highest-risk, hardest-to-reach individuals. Surface disparities first; then design interventions that actually reach those people.
Hadaco in practice: what employer outcomes look like
A mid-sized employer with a self-funded health plan faces a familiar problem: claims costs rising faster than revenue, a benefits team with limited visibility into which employees are at risk, and a wellness program with low engagement. The analytics gap is not a lack of data. It is a lack of a unified view that connects clinical risk to actionable outreach.
Hadaco's approach starts with integrating existing benefits data, claims feeds, and health risk information into a single population view. From there, evidence-based interventions target chronic disease management, preventive care gaps, and mental health needs. The program layers onto existing benefits without replacing them, so there is no disruption to current plan structures and no upfront fee to justify to the CFO.
Hadaco reports measurable savings per employee in the first year, tracked through quarterly reporting that gives HR and finance teams a clear, validated view of outcomes.
What drives those results is not the technology alone. It is the combination of a clean data foundation, HR and clinical alignment on intervention priorities, and a performance-based engagement model that keeps accountability visible. Quarterly reporting creates a feedback loop: what is working gets scaled, what is not gets adjusted. That cadence is what separates programs that sustain savings from ones that produce a one-year spike and then plateau.
Employers who want to understand their specific savings potential can use Hadaco's transparent savings estimator before committing to any program.
Key Takeaways
Population health analytics delivers measurable employer savings and quality improvements only when a clean data foundation, validated risk models, and EHR-embedded workflows are in place before advanced modeling begins.
| Point | Details |
|---|---|
| Data foundation first | Build a unified longitudinal patient record before deploying predictive models. |
| Require validated risk models | Look for peer-reviewed methodology like the Johns Hopkins ACG System as a benchmark. |
| Embed insights in workflow | Analytics that live outside the EHR rarely change clinician behavior or close care gaps. |
| Measure the right first-year KPIs | Track cost per employee, gap-closure rate, outreach engagement, and ED utilization changes. |
| Hadaco employer results | Hadaco delivers an average savings of $451 per employee in year one, with no upfront fees and quarterly outcome reporting. |
The technology is the easy part
Most organizations that struggle with population health management programs have a cultural problem, not a technology problem. The platforms exist. The validated methodologies exist. What fails is the assumption that deploying software is the same as deploying a program.
Two cultural moves consistently separate programs that scale from ones that stall. First, clinician-led pilots. When a physician or care manager helps design the alert logic and workflow integration, adoption follows. When IT or a vendor designs it in isolation, clinicians find workarounds within weeks. Second, transparent ROI reporting to HR and finance. When benefits leaders see quarterly data showing which interventions moved costs and which did not, they stay engaged and fund the next phase. When reporting is vague or annual, programs quietly lose organizational support.
Governance rhythms matter more than governance documents. A monthly data operations review catches feed issues before they corrupt a risk model. A quarterly outcome review with clinical and HR leadership keeps the program accountable to real results, not activity metrics. Annual fairness audits ensure the program is not inadvertently optimizing for easy-to-reach members while missing the highest-risk individuals.
The organizations that get this right treat population health analytics as an operational discipline, not a technology deployment. The tool is the starting point. The culture is what makes it stick.
Hadaco gives employers measurable results without upfront risk
Most population health programs ask employers to pay first and measure later. Hadaco works the other way. The program integrates with your existing benefits structure, addresses chronic disease, preventive care, and mental health, and delivers transparent quarterly reporting so you see exactly what is working.
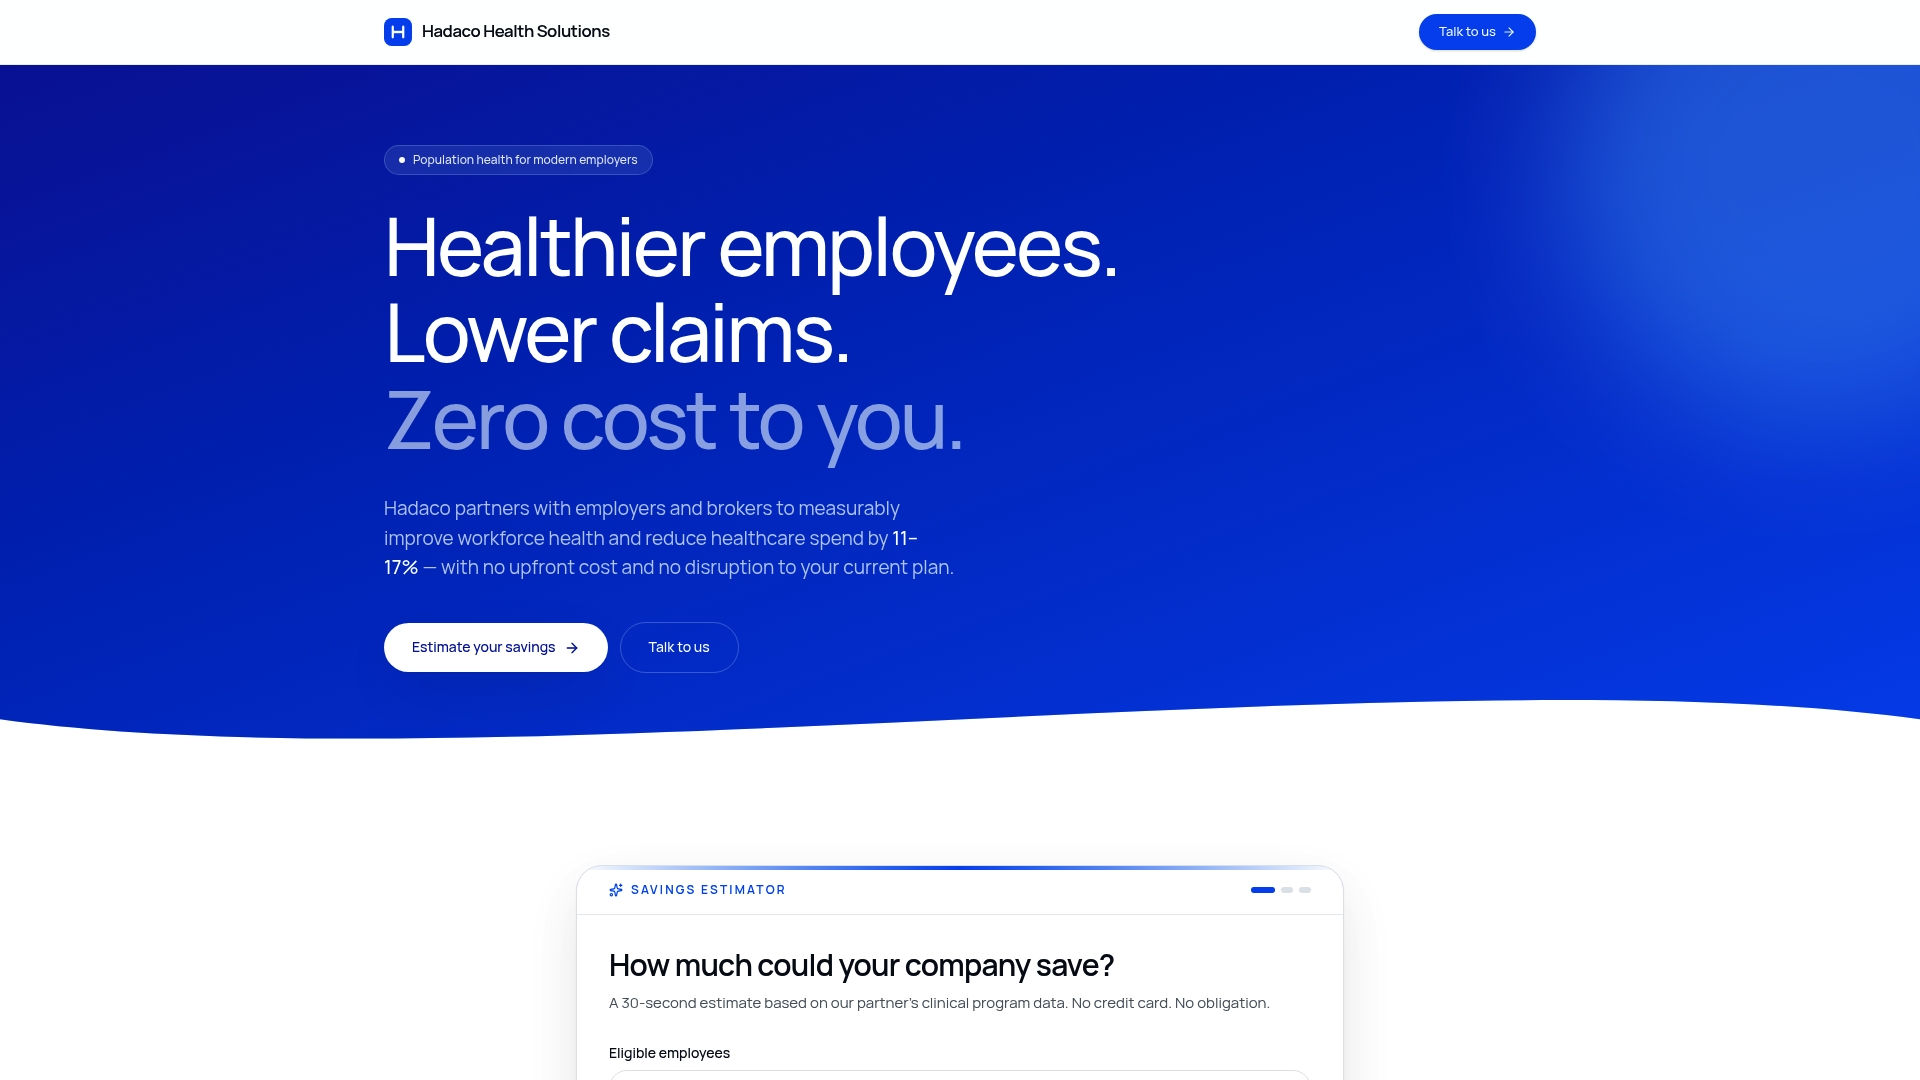
Employers typically see an average savings of $451 per employee in the first year, with improved engagement and retention tracked alongside clinical outcomes. The performance-based model means Hadaco's incentives are aligned with yours: results drive the relationship, not a subscription fee. HR and benefits leaders can use the savings estimator to see a projected outcome before committing to anything. If you want to understand what a population health program could deliver for your workforce, book a consultation with Hadaco and get a clear picture of your savings potential.
Selected sources and further reading
- The Johns Hopkins ACG System — Population Health Analytics: The primary reference for the ACG risk-stratification methodology, including validation evidence and international use cases.
- The World's Foremost Population Health Analytics Tool — Johns Hopkins Bloomberg School of Public Health: Background on the ACG System's development and global adoption, useful for understanding its validation depth.
- Population Health Analytics: A Data Science Perspective — CGI ebook: Covers the shift from descriptive to predictive and prescriptive analytics and the data integration requirements that enable it.
- Best Practices for Population Health Management — Tableau whitepaper: Four evidence-based practices for embedding analytics into clinical workflows and reducing alert fatigue.
- Gartner Peer Insights: Healthcare Provider Population Health Management Platforms: Practitioner reviews of PHM platforms, useful for benchmarking vendor claims against real-world implementation experience.
- Employee Health Risk Assessment: A Guide for HR Teams — Hadaco blog: Practical guidance on building longitudinal employee risk profiles and structuring a data-first approach.
- Care Gap Closure for Employers: A 2026 HR Guide — Hadaco blog: Step-by-step employer guidance on identifying and closing care gaps using analytics-driven outreach.
- Employer Healthcare Trends 2026 — Hadaco blog: Forward-looking context on benefit design and analytics investment priorities for HR and benefits leaders.