
A wellness quarterly review must produce a finance-ready scorecard that links engagement to actual health and cost signals and ends in 1 to 3 approved actions with named owners. Anything less, a slide deck of attendance numbers and satisfaction scores, isn't a review. It's decoration.
TL;DR:
- Wellness program participation should be tracked against a consistent denominator, such as eligible or activated employees, without mid-year swaps to ensure accurate trend analysis.
- ROI calculations must clearly define whether they assess claims only or include productivity gains, as these choices can significantly affect the reported savings.
- The quarterly review should focus on measurable, finance-ready KPIs like claims trend and preventive-care uptake, with supporting details in appendices for context and method transparency.
- Frequent data validation by HR, vendors, and benefits brokers before the meeting prevents errors and ensures reliable numbers for decision-making.
- Next quarter’s goals must directly follow from previous action items, with clear owners, deadlines, and verification metrics to ensure accountability and progress.
Table of Contents
- What Should a Wellness Quarterly Review Cover?
- How Do You Calculate Wellness Program ROI Correctly?
- How Should the Quarterly Decision Meeting Run?
- Compliance and Privacy Rules You Can't Skip
- Build the One-Page Quarterly Packet
- What Makes a Good Wellness Scorecard Template
- Who Besides Leadership Should Review the Results?
- How Do You Set Next Quarter's Goals From These Results?
- Author Perspective: Making the Review a Decision Tool
- How Hadaco Handles Quarterly Wellness Reporting
- Sources
- FAQ
What Should a Wellness Quarterly Review Cover?
A wellness quarterly review is a structured 90-day assessment. It connects implementation and engagement data to health, utilization, workforce, and financial outcomes, not just attendance counts, according to the CDC's framework for evaluating workplace wellness. That distinction changes what belongs on the scorecard.
Track participation and completion by program and population first. Layer in preventive-care uptake, chronic-condition or risk-factor indicators where you have them, mental-health engagement, utilization and claims-cost trends, absenteeism or productivity proxies, and retention. The CDC's own guidance treats this breadth as the baseline, not an aspirational add-on.
Denominator discipline is where most reports quietly fall apart. If Q1 measured "activated" employees and Q3 measured "eligible" employees, your participation trend line is fiction. Pick one denominator category, eligible, invited, activated, or completer, label it on every chart, and never swap it mid-year.
Segmentation adds value until it doesn't. Breaking results out by site or demographic group is useful, but small cells (say, under 10 to 20 people) produce noisy, potentially identifying numbers. Suppress or aggregate those cells rather than publish a rate built on eight people.
For presentation, show trend against the prior quarter and the same quarter a year ago, side by side. A cohort funnel, eligible to invited to activated to completed, tells leadership more in one glance than five bar charts.
- Participation and completion, segmented by program
- Preventive-care uptake and screening completion
- Chronic-condition or risk-factor indicators where data exists
- Mental-health engagement (EAP utilization, app activity)
- Utilization and claims-cost trend
- Absenteeism, productivity proxies, and retention
Pro Tip: Pick one leading indicator (like preventive-care completion) and one finance-facing KPI (like claims trend) to headline every quarterly deck. Bury the rest in an appendix. Executives remember two numbers, not twelve.
How Do You Calculate Wellness Program ROI Correctly?
Start by defining two things in writing before you calculate anything: the investment denominator (total program cost divided by what population) and what counts as savings. Medical claims only? Or medical plus productivity gains like reduced absenteeism? Those two choices alone can swing a reported ROI by a factor of two or three, and most vendor pitches never disclose which one they used.
Here's a repeatable sequence:
- Fix the denominator. State whether ROI is calculated against eligible employees, enrolled employees, or active participants, and hold that constant across quarters.
- Choose your comparison design. A randomized or matched, risk-adjusted comparison beats a naive participant-versus-nonparticipant split, since people who opt into wellness programs tend to be healthier or more motivated to begin with, a selection bias that inflates apparent savings if left uncorrected.
- Flag claims runout. Recent-quarter claims are provisional; they take months to fully mature. Treat them as such and pair them with leading indicators, not as a final verdict.
- State your assumptions and limits. Sensitivity ranges, excluded cost categories, and required sign-offs belong in the same document as the headline number.
Temper expectations with the actual randomized evidence. A JAMA cluster randomized trial tracking a large workplace program found real gains in self-reported exercise and weight-management behavior after 18 months, but no significant difference in clinical measures, healthcare spending, or utilization. A three-year follow-up on the same population found the same pattern held: behavioral change, but no detectable dent in spending, absenteeism, or turnover even after three years.
That's not a reason to abandon measurement. It's a reason to separate what you can claim quarter to quarter (engagement, behavior change) from what needs a longer, controlled analysis (attributable dollar savings). Reserve the confident financial statements for studies with real follow-up and a counterfactual, and use the claims data integration approach to keep your quarterly denominators consistent as you build toward that longer view.
How Should the Quarterly Decision Meeting Run?
The meeting exists to produce decisions, not to admire a dashboard. Run it in this order: confirm the quarter's objectives and baseline, present the validated scorecard, separate leading signals (engagement, screening completion) from lagging ones (claims trend), then approve 1 to 3 corrective actions with owners and firm deadlines. Close by documenting what you'll measure next quarter and how.
Prioritize low-effort, high-impact fixes over ambitious overhauls that stall in committee. A low-participation site probably needs a communication fix or a scheduling change, not a brand-new evidence-based intervention (EBI) rolled out untested.
Every action approved in the meeting needs four things attached to it:
- A named owner (not a department, a person)
- A firm deadline
- A verification metric due at next quarter's review
- A short risk note flagging what could derail it
Skip any of those four and the action quietly dies before the next quarter starts. If low participation is the recurring problem, a low-lift pilot like a scheduled wellness lunch series can serve as a fast, low-risk test action with a clear owner and a four-week verification window.
Compliance and Privacy Rules You Can't Skip
Before any report leaves HR's hands, check the incentive math. Federal guidance caps health-contingent wellness incentives at generally 30% of the cost of employee-only coverage, rising to 50% for tobacco-cessation programs, and requires a reasonable alternative standard for anyone who can't meet the original one, per Departments' guidance on wellness incentives.
Wellness compliance doesn't override ADA, HIPAA, or GINA. GINA specifically restricts collecting genetic or family-history information, even inside a friendly-looking health risk assessment.
- Cap incentives at the federal thresholds and document your reasonable-alternative process
- Route any HRA or incentive design change through legal review before launch
- Aggregate and suppress small cells before publishing segmented results
- Restrict report access by role and log who can see individual-level data
Build the One-Page Quarterly Packet
A quarterly packet works best as one executive page backed by supporting detail, not a 40-slide deck nobody reads past page 3. Structure it in four layers: the executive scorecard, a KPI appendix with denominators and claims-runout status spelled out, a methods and assumptions page, and the action register from the decision meeting.
The executive page itself should carry three finance-ready KPIs, one leading indicator, a short written verdict (two or three sentences, not a paragraph of hedging), and one equity or risk note flagging anything like a small-cell suppression or a demographic gap.
Different readers need different things from the same packet:
- CFOs want the claims trend, the ROI assumptions, and the confidence range, in that order.
- CHROs want engagement trend, retention signal, and the action register status.
- Site leaders want their own site's numbers against the company baseline, plus what's being asked of them next quarter.
| Packet page | Primary audience | Core content |
|---|---|---|
| Executive scorecard | All leadership | 3 KPIs, verdict, equity note |
| KPI appendix | Analysts, auditors | Denominators, runout status |
| Methods and assumptions | CFO, legal | Comparison design, limits |
| Action register | HR, site leaders | Owners, deadlines, metrics |
A KPI checklist built around three core metrics gives you a reasonable starting template if you're building this packet from scratch.
What Makes a Good Wellness Scorecard Template
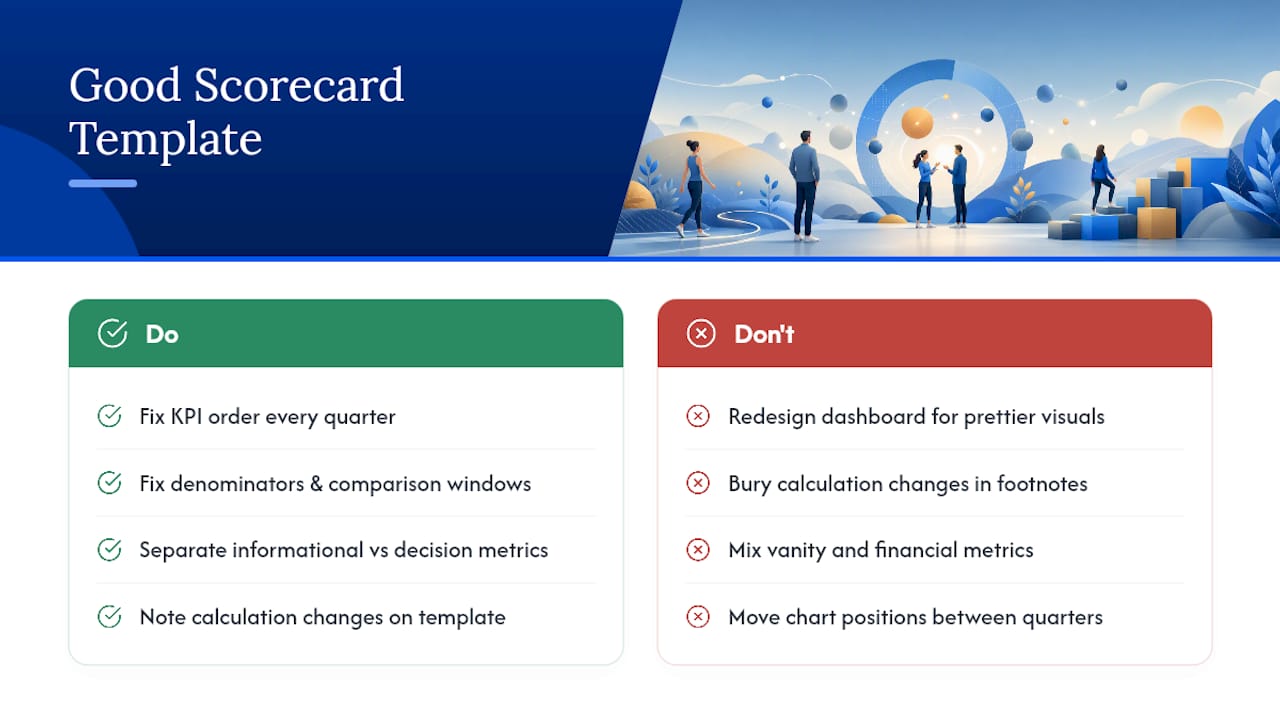
A usable scorecard template repeats the same visual grammar every quarter so leadership can scan it in under two minutes. That means fixed KPI order, fixed denominators, and fixed comparison windows, quarter-over-quarter and year-over-year, in the same chart position every time.
Resist the temptation to redesign the dashboard whenever a new tool or vendor promises prettier visuals. Consistency in layout is what lets a CFO spot a real trend break instead of wondering if the chart just moved. The best templates also separate "informational" metrics (participation, satisfaction) from "decision" metrics (claims trend, risk-factor movement) visually, often with color or section breaks, so nobody mistakes a vanity number for a financial signal.
Keep a version history. When you change how a KPI is calculated, note the change date on the template itself, not buried in a footnote three pages later. That single habit prevents the awkward moment six months from now when someone asks why participation "dropped 15 points" and the real answer is that the denominator changed, not the program.
Finally, build in a standing appendix slot for "context events," a leadership change, a benefits redesign, a layoff, anything that could explain a metric swing that has nothing to do with the wellness program itself.
Who Besides Leadership Should Review the Results?
Leadership approves the actions, but the people who catch data problems before they hit the boardroom are usually HR analysts, benefits brokers, and program vendors. Loop them in before the meeting, not during it.
HR should own denominator validation and privacy checks weeks ahead of the review, not the day before. Benefits brokers or consultants often hold the claims data and can flag runout issues or plan changes that would otherwise confuse a quarter-over-quarter comparison. Wellness vendors, meanwhile, know their own program's completion mechanics better than anyone, useful for catching a data-export error before it becomes a false "participation collapse" headline.
Give each of these groups a specific, narrow role rather than a vague invitation to "weigh in." Analysts validate numbers. Brokers flag claims timing. Vendors confirm program-side data integrity. Site managers add ground-truth context leadership can't see from a spreadsheet. A short pre-read circulated 48 hours before the meeting, with each stakeholder's section flagged, cuts meeting time roughly in half and avoids the awkward mid-meeting "wait, is this number right?" spiral.
How Do You Set Next Quarter's Goals From These Results?
Goals for the next quarter should come directly out of the action register, not out of a fresh brainstorming session. If this quarter's review approved three corrective actions, next quarter's goals are simply: did those three things happen, and did the verification metric attached to each one move?
Where a KPI missed its expected trend, decide whether the target itself was unrealistic or whether execution fell short, and say which one explicitly in the packet. Conflating the two leads to either abandoning a sound goal too early or repeating an unrealistic one for another quarter.
New goals should stay proportional to what actually changed in the underlying program. Don't set an aggressive claims-reduction target off the back of one good participation quarter. The randomized evidence is clear that behavior change and cost change move on very different timelines. Set participation and engagement targets quarterly; set financial targets on a longer horizon with clearly stated assumptions.
Author Perspective: Making the Review a Decision Tool
Denominator discipline and an action register sound like paperwork until you watch a program get killed over a number that was never comparable to begin with. That's the real failure mode, not weak data, but inconsistent data dressed up as a trend. Hadaco's quarterly reporting is built around a transparent savings estimator specifically to avoid that trap, giving employers a documented baseline rather than a moving target.
— Gene
How Hadaco Handles Quarterly Wellness Reporting
Hadaco gives employers something most wellness vendors won't: a transparent savings estimator paired with quarterly reporting built on finance-ready KPIs, not attendance counts. That matters because, as this guide covers, the gap between a credible quarterly review and a vanity metrics deck usually comes down to denominator discipline and honest ROI assumptions, exactly the areas where most in-house reporting quietly breaks down.
Hadaco's programs plug into your existing benefit plans without disrupting them, addressing chronic disease, preventive care, and engagement through evidence-based interventions with no upfront fees. Employers have seen notable first-year savings per employee, alongside improved engagement and retention, backed by a quarterly report that shows exactly where those numbers come from. If your current wellness reporting can't survive the kind of denominator and evidence scrutiny this guide describes, start a consultation with Hadaco and see what a transparent quarterly scorecard actually looks like.
Sources
- Placing Workplace Wellness in Proper Context: Value Beyond Money - CDC
- Effect of a Workplace Wellness Program on Employee Health and Economic Outcomes - JAMA (2019)
- DOL guidance on wellness programs, incentives, and nondiscrimination
FAQ
How Often Should a Wellness Program Be Reviewed?
A full wellness quarterly review every 90 days is the standard cadence, paired with lighter monthly check-ins on leading indicators like participation and screening completion. Reserve deep financial analysis for annual or multi-year reviews, since claims data needs time to mature before it reflects real trends.
What KPIs Matter Most in a Quarterly Health Review?
Participation and completion by program, preventive-care uptake, utilization and claims-cost trend, and retention form the core set, according to CDC guidance on workplace wellness evaluation. Pick one finance-facing KPI and one leading indicator to headline the executive summary rather than presenting all metrics with equal weight.
Can a Quarterly Review Prove Wellness Programs Save Money?
Not on its own. Randomized trials, including an 18-month JAMA study and a three-year follow-up, found behavioral improvements but no significant short-term reduction in healthcare spending. A quarterly review should track engagement and leading indicators, while attributable savings claims need longer-term, controlled analysis.
What Does Hadaco Include in Its Quarterly Reporting?
Hadaco provides a transparent savings estimator alongside quarterly reporting on measurable outcomes, giving employers a documented baseline instead of an unverifiable number. Programs are delivered with no upfront fees and are designed to complement existing benefit plans rather than replace them.
How Do You Avoid Misleading Wellness ROI Numbers?
Define your investment denominator and what counts as savings before calculating anything, and use a matched or risk-adjusted comparison instead of a simple participant-versus-nonparticipant split, which is prone to selection bias. Document assumptions and confidence ranges directly in the report so leadership can judge how solid the number actually is.