
Employee wellness analytics is the practice of using integrated workforce, benefits, and health data to measure employee health and predict where programs will improve outcomes. Start by asking one clear question: what does success look like for your workforce this year? Instrument that signal before you touch a single dashboard.
The business case is direct. Organizations that apply wellness data analytics to target their interventions spend less on avoidable claims, lose fewer people to preventable burnout, and can show finance a number tied to every program dollar. The CDC's workplace health promotion frameworks and the WHO's integrated healthy workplace guidance both point to the same conclusion: programs designed with measurement built in outperform those that add reporting as an afterthought.
Key Takeaways
Employee wellness analytics produces measurable business outcomes only when it starts with a defined success question, a clean baseline, and a pilot designed to prove impact before scaling.
| Point | Details |
|---|---|
| Start with one metric | Define a single primary success question and baseline that metric before building any dashboard. |
| Prioritize high-cost claimants | The high-cost claimant cohort typically drives disproportionate spend; target them first with case management. |
| Pilot before scaling | A 90-day pilot with a matched comparison group produces more reliable evidence than a year of descriptive reporting. |
| Privacy is non-negotiable | Aggregate all reporting to groups of 10–15 or more; require data-use agreements from every vendor before data flows. |
| Hadaco's performance model | Hadaco delivers evidence-based population health programs with no upfront fees, a savings estimator, and quarterly outcome reporting. |
Table of Contents
- What employee wellness analytics actually covers
- Why HR leaders should invest in wellness analytics now
- Which metrics and KPIs should you track first?
- What data sources power reliable wellness analytics?
- How to analyze wellness data: from baseline to intervention
- Moving from insight to program: pilots, personalization, and scale
- Privacy, ethics, and compliance in employee wellness data
- How to report results and demonstrate ROI to stakeholders
- How Hadaco operationalizes wellness analytics
- What most HR teams get wrong about wellness analytics
- Hadaco delivers measurable outcomes without upfront risk
- Sources
What employee wellness analytics actually covers
Employee wellness analytics sits at the intersection of benefits data, HR data, and health outcomes data. It is not the same as benefits reporting, which typically stops at enrollment counts and plan costs. It is not raw claims analytics, which describes what was spent but rarely explains why or what to do next.
The field covers workforce health signals (biometric screenings, EAP utilization, absence patterns), program effectiveness measures (participation rates, behavior change indicators, risk-score shifts), and productivity proxies (output per full-time equivalent, time-to-complete, presenteeism indices). When done well, it connects those signals to business outcomes: turnover, disability costs, and total healthcare spend.
The NIOSH Total Worker Health initiative offers a useful model here. It recommends integrating occupational safety data with wellbeing data to eliminate the silos that cause organizations to miss compounding risks, such as a high-injury role that also shows elevated mental health claims. Wellness analytics that ignores safety data is working with an incomplete picture.
Pro Tip: Define the boundary of your analytics program in writing before you collect a single data point. Specify which data sources are in scope, which populations are covered, and which decisions the data will and will not inform. That document becomes your governance anchor.
Why HR leaders should invest in wellness analytics now
Analytics reduces uncertainty. Without it, HR leaders are allocating program budgets based on vendor promises and gut feel, and finance has no way to validate the spend. With it, you can target interventions at the populations and risk factors that drive the most cost, and you can show a before-and-after number.
The evidence on program effectiveness is more nuanced than most vendor decks suggest. A RAND research brief found modest health improvements in many workplace wellness programs but mixed evidence for broad healthcare-spending reductions across all employers. A PubMed-indexed review similarly shows that targeted interventions can reduce specific risk factors, though evidence quality varies by setting. The takeaway is not that programs don't work. It's that undifferentiated programs applied to the wrong populations produce weak results, and analytics is what tells you which populations and which interventions to pair.
Statistic to use with finance: Harvard Health research notes that evidence for large healthcare-cost savings is mixed and depends heavily on program quality and measurement rigor — which is precisely the argument for investing in analytics before scaling any program.
What happens when organizations skip analytics entirely:
- Program dollars flow to high-participation, low-risk employees who would have stayed healthy anyway
- Low-risk claimants get incentives; high-cost claimants get nothing targeted
- Finance sees a line item with no ROI story, and the program gets cut
- Turnover among stressed, high-performing employees goes undetected until exit interviews surface it too late
For a benchmark conversation with your CFO, employer healthcare trends show that healthcare costs per employee continue to rise year over year, making the cost of inaction a defensible number in its own right.
Which metrics and KPIs should you track first?
Start with the metrics that connect most directly to cost and retention. The five highest-impact measures for most mid-size employers are:
- Short-term absence rate: Lost work days divided by available work days in the period. Requires payroll or HRIS absence data. A rising rate is often the earliest signal of burnout or unmanaged chronic conditions.
- High-cost claimant rate: Number of employees with claims above a defined threshold (commonly $50,000 annually) per 1,000 covered lives. Requires claims data from your TPA or carrier. This cohort typically drives a disproportionate share of total spend.
- EAP utilization rate: Unique users who accessed EAP services divided by total eligible employees. Low utilization often signals stigma or poor program awareness, not a healthy workforce.
- Wellbeing index or Net Thriving score: A composite from pulse surveys measuring energy, purpose, social connection, and financial security. Gallup's Net Thriving methodology is a widely used benchmark.
- Productivity proxy: Output per FTE, time-to-complete on standard tasks, or manager-rated performance scores. ACOEM's Health and Productivity Management Center provides standard definitions for presenteeism and absenteeism-related productivity loss.
Three example calculations:
- Short-term absence rate = (Total lost work days in period) ÷ (Total available work days in period) × 100
- High-cost claimant rate = (Employees with claims ≥ $50,000) ÷ (Total covered lives) × 1,000
- EAP utilization rate = (Unique EAP users in period) ÷ (Total EAP-eligible employees) × 100
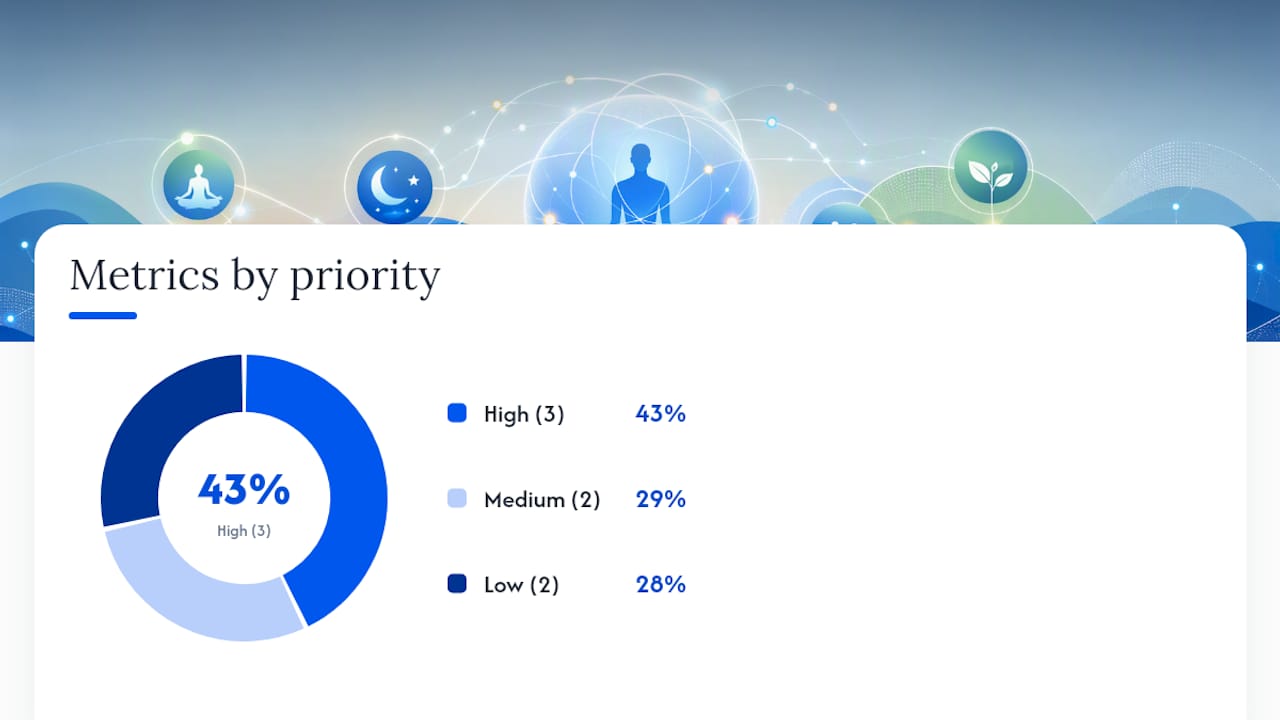
| Metric | Priority | Why start here |
|---|---|---|
| Short-term absence rate | High | Early burnout signal; HRIS data usually available immediately |
| High-cost claimant rate | High | Drives disproportionate spend; actionable with targeted case management |
| EAP utilization rate | High | Low cost to track; reveals engagement and stigma gaps |
| Wellbeing index | Medium | Requires survey infrastructure; leading indicator of future claims |
| Productivity proxy | Medium | Harder to standardize; powerful once baseline is established |
| Biometric risk scores | Low | Valuable but requires screening events and privacy governance |
| Turnover by health risk tier | Low | Analytically rich but needs data linkage across HR and health systems |
What data sources power reliable wellness analytics?
The best data source is the one you already have, cleaned and documented. Most employers have more usable data than they realize; the problem is usually fragmentation, not scarcity.
Medical and pharmacy claims are the most clinically precise source. They show diagnosis codes, treatment patterns, and cost by condition. The limitation: claims lag by 60–90 days and reflect utilization, not health status. An employee managing a chronic condition well may show high claims but be thriving.
Pulse surveys give you current wellbeing sentiment, often within days of fielding. They are fast and flexible but suffer from response bias: the employees most likely to skip a survey are often the ones most at risk. APA research links workplace wellbeing to reduced mental health stigma and improved functioning, which makes survey design that normalizes mental health topics especially important.
HRIS and absence data are the most universally available source. Absence patterns, leave requests, and accommodation records are already sitting in your system. The challenge is inconsistent coding across managers and locations.
EAP utilization reports come from your EAP vendor and are already de-identified at the aggregate level. They are underused as an analytics input.
Wearable and biometric data can identify fatigue and recovery trends that claims data miss entirely, but they require privacy-first architectures and explicit employee consent. Aggregate-only reporting is the minimum standard.

Pro Tip: Merge data sources on a de-identified employee ID, not on name or Social Security number. Work with your legal and privacy team to establish a data-use agreement with every vendor before any data flows into your analytics environment. This step takes two weeks and prevents years of compliance exposure.
Financial wellness signals, such as participation in emergency savings programs or 401(k) hardship withdrawals, are an underused data source. Financial wellness program data can surface financial stress before it shows up as absenteeism or turnover.
How to analyze wellness data: from baseline to intervention
The recommended workflow has five stages: baseline, segmentation, hypothesis, pilot, and measurement. Skipping any stage is where most programs go wrong.
Baseline means documenting your current state across your priority metrics before any intervention. Without it, you cannot prove causation or even correlation.
Segmentation means breaking your population into cohorts by role, location, risk score, or demographic cluster. A wellness program that works for sedentary office workers may do nothing for a field-based workforce with high physical demands.
Hypothesis means stating, in writing, what you expect to happen and why. "If we deploy a targeted chronic disease management program for the 200 employees in our high-cost claimant cohort, we expect to reduce their average annual claims by X% over 12 months."
Pilot means testing that hypothesis on a defined cohort before scaling. A difference-in-differences approach, comparing your pilot cohort to a matched control group over the same period, is the most defensible method for demonstrating program impact.
Measurement means tracking your primary and secondary metrics at a pre-defined cadence and reporting results transparently, including null results.
Common pitfalls to avoid:
- Confusing correlation with causation (healthy employees self-select into wellness programs; their lower claims don't prove the program worked)
- Using descriptive dashboards as a substitute for analysis (a dashboard showing utilization rates is not an insight; a dashboard showing utilization rates by risk tier is)
- Selecting tools based on feature lists rather than the quality of the underlying data model
- Ignoring HBR's warning that analytics applied to programs without addressing upstream organizational issues (workload, psychological safety, management quality) will show weak results regardless of program quality
Pro Tip: When evaluating analytics platforms, ask the vendor to show you a sample output for a population like yours, not a demo dataset. The gap between a polished demo and a real-world output is where most platform disappointments live.
Moving from insight to program: pilots, personalization, and scale
Small, measured pilots are the most reliable path from analytics output to scaled program. A pilot that fails to show impact is not a failure; it is information that saves you from scaling something that doesn't work.
Use a simple prioritization matrix before choosing what to pilot. Score each candidate intervention on two axes: expected impact (based on your analytics) and implementation feasibility (cost, timeline, vendor readiness). Pilot the high-impact, high-feasibility interventions first.
A pilot template for HR teams:
- Hypothesis: State the expected outcome, the mechanism, and the population
- Cohort selection: Define inclusion criteria and identify a matched comparison group
- Intervention details: Specify the program, delivery channel, duration, and any incentives
- Duration: 90 days minimum for behavior change; 12 months for claims impact
- Primary metric: One metric that determines success or failure
- Secondary metrics: Two to three supporting measures (engagement, utilization, satisfaction)
- Sample size check: Confirm the cohort is large enough to detect a meaningful difference
Measurement checklist before you launch:
- Baseline documented for all primary and secondary metrics
- Comparison group identified and matched on key variables (age, risk score, role)
- Reporting cadence agreed with stakeholders (monthly for program owners, quarterly for finance)
- Statistical check planned for end of pilot (minimum detectable effect, confidence level)
Wellness incentives that drive participation are worth designing into the pilot from the start.
Privacy, ethics, and compliance in employee wellness data
Employee wellness data is among the most sensitive data an employer handles. A privacy-first architecture is not optional; it is the foundation that determines whether your analytics program survives its first legal review.
Core compliance requirements for U.S. employers:
- HIPAA applicability: If your wellness program is integrated with a group health plan, HIPAA's privacy and security rules apply to protected health information. Understand which data flows trigger HIPAA and which are governed by other frameworks (ADA, GINA, state privacy laws).
- De-identification: Aggregate all reporting to groups of at least 10–15 employees before any output reaches a manager or HR business partner. Individual-level health data must never reach a supervisor.
- Minimum necessary standard: Collect only the data required to answer your defined analytics questions. Every additional data point is an additional liability.
- Data-use agreements: Require a signed DUA from every vendor who touches employee health data. Audit compliance annually.
- Vendor due diligence: Ask vendors for their HIPAA Business Associate Agreement, their data retention and deletion policy, and their breach notification procedures before signing any contract.
Pro Tip: Design your wellness program as opt-in, not opt-out, for any data collection beyond what is strictly required for benefits administration. Opt-in design builds trust, reduces legal exposure, and tends to produce higher-quality data because participants are genuinely engaged.
Transparency with employees matters beyond compliance. When employees understand what data is collected, how it is used, and what decisions it does and does not influence, participation rates and data quality both improve. A one-page plain-language data notice, reviewed by legal, is a low-cost trust investment.
How to report results and demonstrate ROI to stakeholders
Report at two cadences: monthly for program owners and quarterly for finance and executive leadership. Monthly reporting tracks leading indicators (participation, utilization, survey scores). Quarterly reporting connects those indicators to lagging financial outcomes (claims trends, absence costs, productivity estimates).
A sample reporting framework:
| Metric category | Metric | Reporting cadence | Audience |
|---|---|---|---|
| Financial | Healthcare claims per member per month | Quarterly | CFO, benefits committee |
| Financial | High-cost claimant count | Quarterly | CFO, benefits committee |
| Engagement | Program participation rate | Monthly | Program owners, HR |
| Engagement | EAP utilization rate | Monthly | Program owners, HR |
| Health outcomes | Wellbeing index score | Quarterly | HR leadership, executives |
| Productivity | Absence rate | Monthly | Program owners, managers |
Trust-signal checklist for every stakeholder report:
- State the methodology used to calculate each metric (formula, data source, period)
- Disclose the comparison group or benchmark used (internal historical baseline, industry benchmark, or matched cohort)
- Report confidence intervals or ranges for any estimated savings figure, not just point estimates
- Flag any data quality issues that affected the period's results
- Include a null-result section: what did not improve and what you plan to do about it
HBR's analysis of wellness program ROI methodology warns specifically about selection bias and regression to the mean as the two most common errors in wellness ROI calculations. Address both in your methodology disclosure. For a detailed ROI framing, corporate wellness ROI guidance walks through the calculation logic HR leaders can use with finance.
How Hadaco operationalizes wellness analytics
Hadaco's approach is performance-based: no upfront fees, quarterly reporting of outcomes, and a savings estimator that gives employers a projected figure before committing to a program. The model integrates with existing benefit plans rather than replacing them, which means implementation does not require a benefits redesign.
The operational stages HR teams typically move through with Hadaco:
- Data connection: Hadaco connects to your existing claims, HRIS, and benefits data. No new data collection infrastructure is required in most cases.
- Baseline establishment: A population health baseline is built across chronic disease prevalence, high-cost claimant concentration, and engagement signals.
- Targeted pilot: Evidence-based interventions are deployed to the highest-risk cohorts first, with defined primary metrics and a comparison group.
- Scaled rollout: Programs that demonstrate impact in the pilot phase are extended to the broader population, with quarterly reporting tracking outcomes.
Companies working with Hadaco often see savings per employee in their first year, with improvements in engagement and retention alongside the claims reduction. The savings estimator on Hadaco's platform lets HR and finance leaders run a projected savings scenario before any commitment.
Pro Tip: When evaluating any population health vendor, ask for quarterly reporting samples from a comparable employer population before signing. Transparent, methodology-disclosed reporting is the clearest signal that a vendor is accountable for outcomes rather than just activity.
What most HR teams get wrong about wellness analytics
The single most common mistake is over-measuring without a clear action plan. HR teams build dashboards with 40 metrics, present them to leadership quarterly, and then do nothing differently because no one agreed in advance which metric would trigger which decision.
Three priorities to start with instead:
- Define your success question first. One question, one primary metric, one baseline. Everything else is secondary until that question has an answer.
- Secure one clean data source. Claims data from your TPA or carrier is usually the most reliable starting point. Get a data-use agreement in place and pull 24 months of history before you do anything else.
- Run a pilot before you scale. A 90-day pilot on a defined cohort with a comparison group will tell you more than a year of dashboard reviews. Workplace wellness challenges are often rooted in scaling programs before proving they work at small scale.
HBR's research is worth keeping on your desk: wellness analytics applied on top of a dysfunctional work environment will show weak results. If your data surfaces high burnout scores, the first question is whether the workload and management environment are the cause, not whether the meditation app subscription needs a refresh.
Hadaco delivers measurable outcomes without upfront risk
Most employers spend years running wellness programs they cannot measure. Hadaco is built for the HR and benefits leaders who are done with that. The model is straightforward: Hadaco integrates with your current benefit plan, identifies the employee populations driving the most cost, and deploys evidence-based interventions targeting chronic disease, preventive care, and mental health. You pay based on demonstrated savings, not on activity.
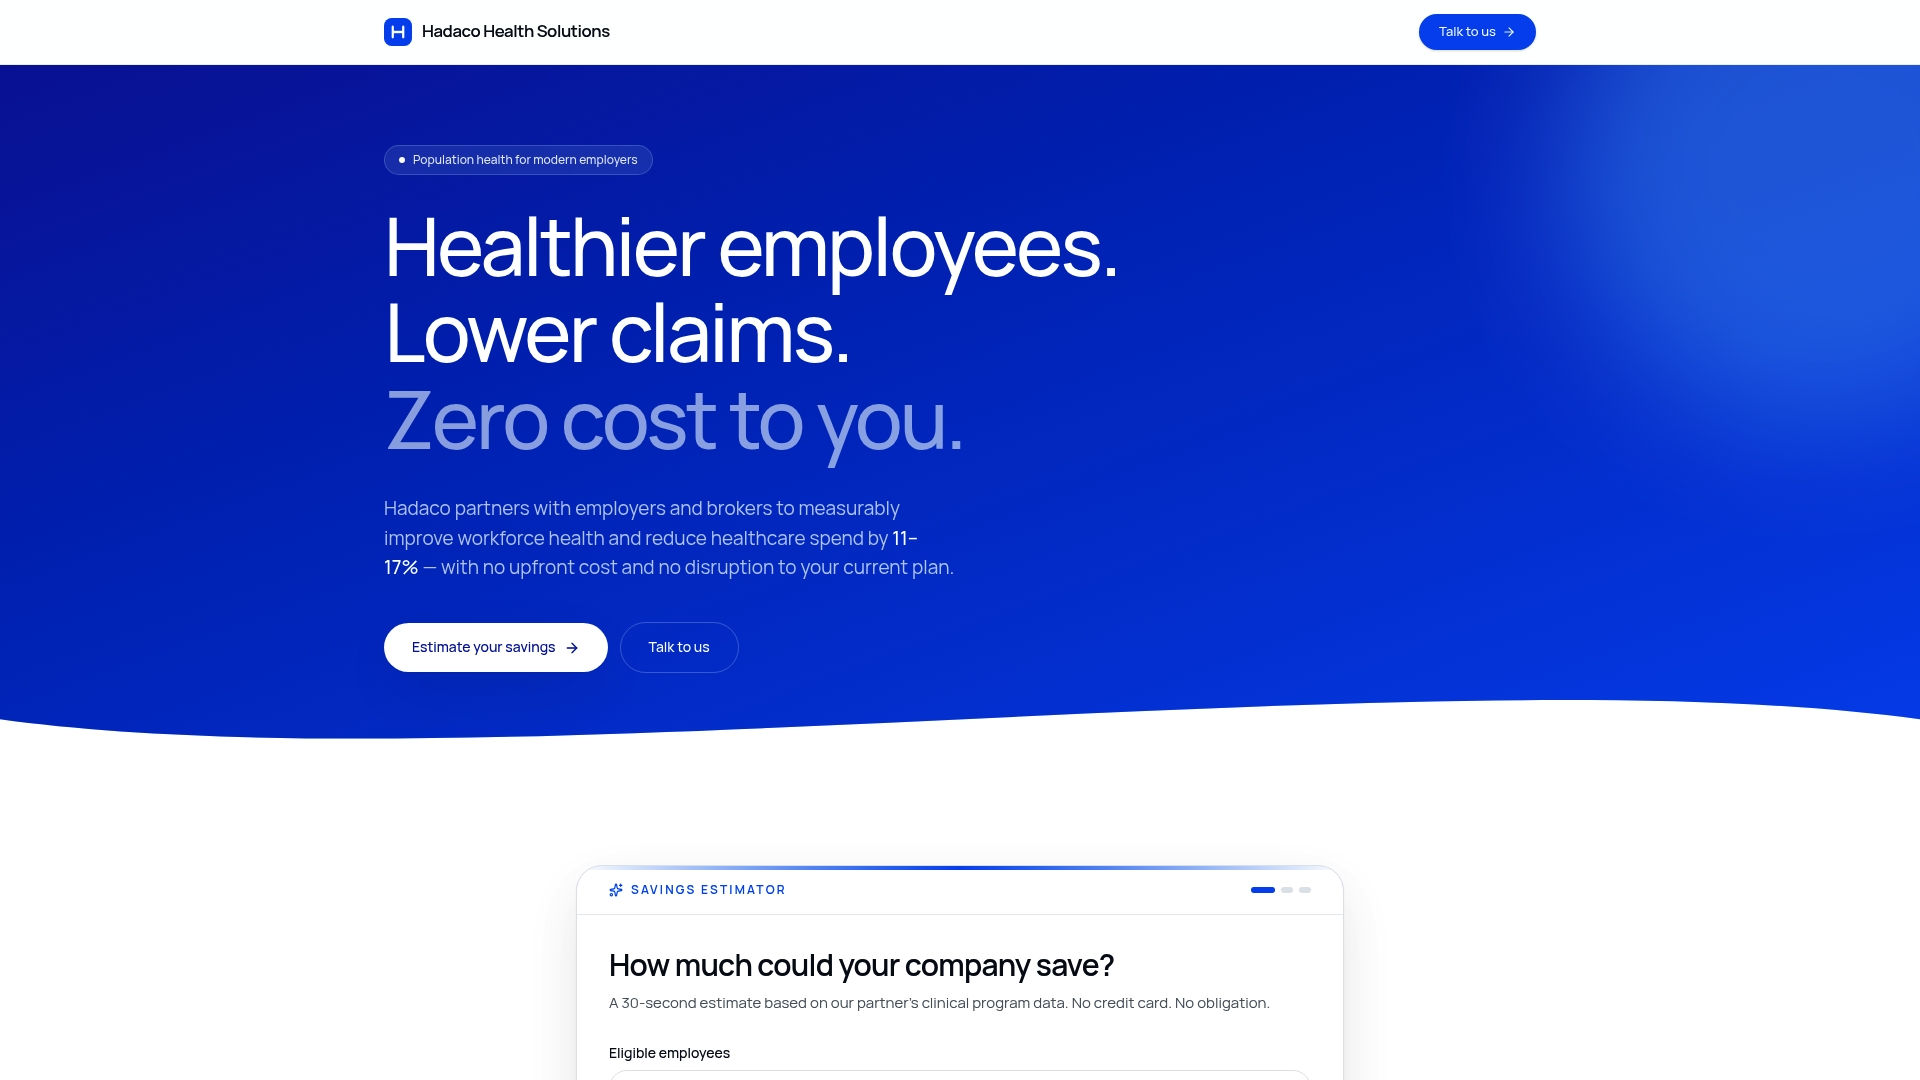
The savings estimator gives CFOs and benefits committees a projected figure before any program starts. Quarterly reporting ties every outcome back to a methodology you can defend in a budget meeting. For mid-size and large employers whose healthcare costs are rising and whose current programs cannot show a number, this is a concrete alternative to another year of blind spending.
Book a consultation with Hadaco to run your savings estimate and see what a performance-based population health program looks like for your workforce.