
Use a claims-based ROI model paired with a productivity conversion. This is the most defensible way for employers with claims data to estimate wellness savings, and it consistently outperforms rule-of-thumb multipliers. Expect a wide range depending on program design and population risk, with pooled behavioral health analyses showing a 2.3 ROI multiple in some cohorts. Start with a quick calculator using your own baseline numbers before committing budget, keeping in mind that actual results can vary widely.
TL;DR:
- A claims-based ROI model with a productivity conversion offers the most credible estimate of wellness savings but requires consistent data and controls for accuracy.
- Most savings are realized over 18 to 36 months, especially when using matched-control comparisons, as early results often overstate impact due to selection bias.
- Participation rates, program comprehensiveness, targeting high-risk groups, and seamless integration with existing benefits significantly influence the actual savings achieved.
- Employers should always update estimates with actual results annually, using a low scenario for budgeting and treating initial projections as directional rather than fixed.
Table of Contents
- Practical methods for estimating wellness savings
- What the research says about typical savings ranges
- A step-by-step estimator you can build in a spreadsheet
- Timing expectations and the biases that skew results
- Hadaco's estimator and reported first-year results
- Which cost categories belong in your estimate
- Preparing your data before you run the numbers
- Common pitfalls that inflate or deflate your estimate
- Benchmarking your numbers against similar employers
- How program design changes the size of your savings
- Updating your estimate as real results come in
- What HR and finance leaders should keep in mind
- Get a savings estimate built around your own numbers
- Sources
- FAQ
Practical methods for estimating wellness savings
Three approaches cover most employer situations, and the right one depends on how much data you already track.
Quick calculators give you a headline number fast. You plug in headcount, average claims cost, and an assumed percentage reduction, and the tool spits out a dollar figure. These are useful for a first pass or a budget conversation, but they hide the uncertainty behind a single number.
Claims-based ROI models are more rigorous. A pre/post comparison looks at your own claims before and after program launch. A matched-control or difference-in-differences design compares participants against a similar group of non-participants, which corrects for the fact that people who join wellness programs often start healthier or more motivated than those who do not.
Productivity-based approaches value the hours you get back from reduced absenteeism and presenteeism. You convert hours saved into dollars using average loaded labor cost, which includes salary plus benefits burden, not just base pay.
Before choosing a method, run these checks on your data:
- Confirm claims data covers a consistent enrolled population across the comparison period.
- Verify absence and disability records use the same coding definitions year over year.
- Check that program participation records are complete enough to separate participants from non-participants.
Employers with clean claims data and at least two years of history can support a matched-control model. Everyone else should start with a calculator and treat the output as directional. Integrating claims data into your wellness evaluation is the step that upgrades a rough estimate into something a CFO will trust.
What the research says about typical savings ranges
Peer-reviewed studies and public-health ROI models give a spread rather than a single number, and that spread is the honest starting point for your own projection.
A pooled analysis of 19 employer cohort studies found a behavioral health ROI multiple of 2.3, corresponding to roughly 14.3% net savings on health plan spend. That figure comes from a site-level meta-analysis covering enhanced behavioral health services, and it sits at the higher end of what most employers should expect.
Other models land lower. A long-running CDC-documented workplace health promotion study estimated savings of about several tens of dollars per member per month with a combined medical and productivity ROI near two and a half dollars per dollar invested. A separate CDC-supplemented cohort study of small employers found a modest return of about two dollars per dollar when medical and productivity savings were combined.

A cardiovascular-focused program reported far larger per-person results, with annual savings near $1,224 per individual and an ROI around 4.90, though that outcome reflects a higher-risk population rather than a typical workforce.
The gap between these numbers comes down to a few variables:
- Baseline health risk in your population changes how much room there is to save.
- Program comprehensiveness, meaning how many risk factors and conditions the program actually addresses.
- Participation rate, since low engagement caps the ceiling on any model's output.
Build three scenarios: low, likely, and high, rather than betting a budget on one point estimate.
A step-by-step estimator you can build in a spreadsheet
This method turns the ranges above into a number specific to your company.
- Pull baseline medical and pharmacy spend per employee from your carrier or TPA reports.
- Pull absence hours and, where tracked, presenteeism survey data from HR or payroll.
- Get program cost from your vendor invoice or proposal, including any per-employee-per-month fee.
- Choose an expected percentage reduction in medical spend, using the ranges from the section above as your low, likely, and high inputs.
- Calculate medical savings: baseline medical spend multiplied by expected percent reduction.
- Calculate productivity savings: hours saved multiplied by average loaded hourly cost.
- Sum medical and productivity savings, then subtract program cost to get net savings.
- Divide total savings by program cost to get ROI.
A worked example with conservative assumptions:
Document every assumption in a visible tab, not buried in a formula, so anyone reviewing the model later can see exactly what drove the result. Run a one-way sensitivity analysis by changing one input at a time, such as the reduction percentage, and watching how net savings shifts. That single exercise will tell you which assumption your budget is most exposed to. Corporate wellness ROI guidance walks through interpreting these outputs in more depth.
Timing expectations and the biases that skew results
Measurable clinical and financial savings usually take longer to show up than most pitches suggest. Reporting on randomized trial evidence found that clinical and spending outcomes are often not detectable at 18 months in large trials, even when behavior change happens earlier. A realistic planning window is 18 to 36 months for measurable medical savings, with some productivity gains visible sooner.
The biggest distortion in naive estimates is selection bias: employees who volunteer for wellness programs tend to be healthier or more motivated already, which inflates a simple pre/post comparison.
Mitigate this with a few concrete steps:
- Use a matched control group or employer-level fixed effects instead of comparing participants to themselves over time.
- Benchmark your results against industry averages rather than assuming your program is an outlier.
- Track participation and outcomes separately for high-risk subgroups, since that is where most savings concentrate.
Pro Tip: Run your estimate twice, once including only participants and once using a matched comparison group, and treat the gap between the two as your bias correction.
Hadaco's estimator and reported first-year results
There are evidence-based population health programs that address chronic disease, preventive care, and employee engagement, designed to integrate with existing benefit plans rather than replace them. Certain estimators provide employers a transparent, upfront view of expected savings before committing to a program, with quarterly reporting to track actual outcomes.
Hadaco reports that companies often see an average savings of $451 per employee in their first year, a figure the company presents as its own internal claim rather than an independent study result. Some programs may run with no upfront fees, shifting financial risk toward the vendor rather than the employer.
A practical way to use this kind of tool:
- Run the estimator with your own headcount and baseline spend to get a company-specific projection.
- Pilot with a defined cohort before rolling out company-wide.
- Review quarterly reports against your original estimate to confirm the numbers are holding.
Which cost categories belong in your estimate
A savings estimate that only counts medical claims understates the real picture, and one that counts everything without discipline overstates it.
Medical claims are the anchor category, since they are the most directly measurable and the category most peer-reviewed models report against. Pharmacy spend deserves its own line rather than being folded into medical, because wellness programs targeting chronic disease often shift drug utilization in ways that are easy to miss if pharmacy and medical are blended.
Absenteeism, meaning full days missed, converts cleanly into dollars using loaded labor cost and days absent. Presenteeism, the productivity lost while an employee is at work but not fully functioning, is harder to measure and should be estimated conservatively, since recoverable hours from presenteeism programs are typically fewer than the hours lost to absence.
Turnover is the category employers most often forget. Replacing an employee carries recruiting, onboarding, and lost-productivity costs, and a program that improves engagement can reduce voluntary turnover in ways that show up on the balance sheet even when medical claims stay flat.
A reasonable estimate includes all five categories but weights them by how confidently each can be measured. Medical claims and pharmacy get the most weight because the data is clean. Absenteeism gets moderate weight. Presenteeism and turnover get conservative multipliers unless you have strong internal data tying them to the program.

Preparing your data before you run the numbers
Bad inputs produce a confident-looking number that means nothing. Before building any model, clean and normalize four data sources.
Start with claims data. Confirm the population covered is stable across your comparison period, meaning the same group of employees enrolled in the same plan, not a population that changed size due to layoffs or acquisitions.
Normalize absence and disability records to a consistent coding standard. If your payroll system changed how it logs sick days partway through the year, that shift alone can create a false savings signal.
Reconcile program participation records against payroll headcount. Gaps here make it impossible to tell who was actually exposed to the program versus who was counted by mistake.
Finally, standardize your time periods. Compare full calendar years or full plan years against each other, never a partial year against a full one, since seasonal claims patterns will distort the comparison.
Once these four checks pass, you have a dataset that can support a matched-control or difference-in-differences model rather than a rough guess. Benefits administration platforms that integrate directly with claims systems can shortcut much of this cleanup work.
Common pitfalls that inflate or deflate your estimate
The most common mistake is the naive pre/post comparison with no control group, which almost always overstates program impact because it credits the program for improvements that healthier, more motivated participants would have seen anyway.
A second pitfall is counting medical savings alone. Models that combine medical and productivity savings consistently show better-looking ROI than medical-only models, and leaving productivity out understates your program's real value.
Double-counting is a quieter problem. If you count both reduced absenteeism hours and reduced presenteeism hours for the same employee without capping the total, you can end up crediting more recovered hours than that person actually worked in a year.
Short measurement windows cause a different kind of error. Expecting medical savings within six months, when the evidence points to an 18 to 36 month window, sets up a program to look like it failed when it simply hasn't had time to show results yet.
Finally, treating vendor-provided ROI numbers as independently verified is a risk. Vendor calculators vary widely in the assumptions built into them, and an employer should ask what percentage reduction, participation rate, and time horizon underlie any number a vendor presents.
Avoiding these five pitfalls does more for the credibility of your estimate than adding another decimal point of precision to your formula.
Benchmarking your numbers against similar employers
An estimate in isolation is hard to judge. Comparing it against published ranges tells you whether your assumptions are reasonable or need adjusting.
If your projected reduction is above 14%, you are at the high end of what pooled behavioral health analyses report, and you should be able to point to a higher-risk population or an unusually comprehensive program to justify it. If your projected per-member-per-month savings sits near $35, that lines up with the long-running CDC-documented model, which is a reasonable middle-of-the-road benchmark for a general workforce.
Industry matters too. A workforce with higher physical demands or older average age will show different baseline risk than an office-based population, which shifts what a credible savings range looks like.
When benchmarking, match on population risk and program comprehensiveness before matching on industry label. Two companies in the same industry with very different baseline health risk will have very different realistic savings ranges, and forcing your estimate to match a same-industry number without checking that underlying risk is a common way benchmarking goes wrong.
How program design changes the size of your savings
Not every wellness program produces the same range of outcomes, and design choices explain most of the difference.
Programs that address a single risk factor, such as smoking cessation alone, tend to produce smaller and narrower savings ranges than comprehensive programs addressing multiple chronic conditions, preventive care, and mental health together. The pooled 2.3 ROI multiple cited earlier comes specifically from enhanced behavioral health services, not a narrow single-issue program.
Participation rate acts as a multiplier on everything else. A program with strong evidence behind it but 10% participation will produce a fraction of the savings the underlying research suggests, simply because most of the workforce never engages.
Integration with existing benefits also matters. A program that requires employees to navigate a separate system, separate enrollment, and separate point of contact tends to see lower engagement than one built to complement the benefits employees already use. Program design elements that reduce friction for the employee generally correlate with the participation rates that make higher savings estimates achievable in practice.
Finally, targeting matters. Programs that focus resources on high-risk subgroups, rather than spreading a flat offering across the whole population, tend to show larger measurable savings per dollar spent, because that is where the most recoverable cost sits.
Updating your estimate as real results come in
Your first estimate is a planning tool, not a fixed target. Treat it as a baseline to revise once actual data starts arriving.
At the 12-month mark, compare actual claims trends against your projected low, likely, and high scenarios. If actual results are tracking below your low scenario, revisit your participation assumption first, since that is the input most likely to have been optimistic.
By 18 to 24 months, you should have enough data to run a more rigorous matched-control comparison instead of relying on the rough percentages you started with. This is also the point where turnover and presenteeism data, which take longer to stabilize than medical claims, become reliable enough to fold into the model with confidence.
Update your assumptions annually at minimum, and treat each renewal cycle as a checkpoint to re-run the sensitivity analysis with a year of real numbers instead of literature-based estimates. A 90-day rollout followed by structured measurement checkpoints gives you natural points to revisit the model without waiting for a full plan year to pass.
What HR and finance leaders should keep in mind
Pilot new programs with your highest-risk cohort first and build a transparent measurement plan before you launch, not after. That single decision determines whether you'll have credible data to defend the investment a year from now.
When budgeting, use your low scenario as the number you present to finance, and treat the likely and high scenarios as upside. Include nonfinancial benefits, like retention and engagement, in how you value the program even when they don't fit neatly into the ROI formula.
— Gene
Get a savings estimate built around your own numbers
Running the calculations above gets you a defensible range, but Hadaco can turn that into a number specific to your workforce with no upfront fees and no disruption to the plan you already have. 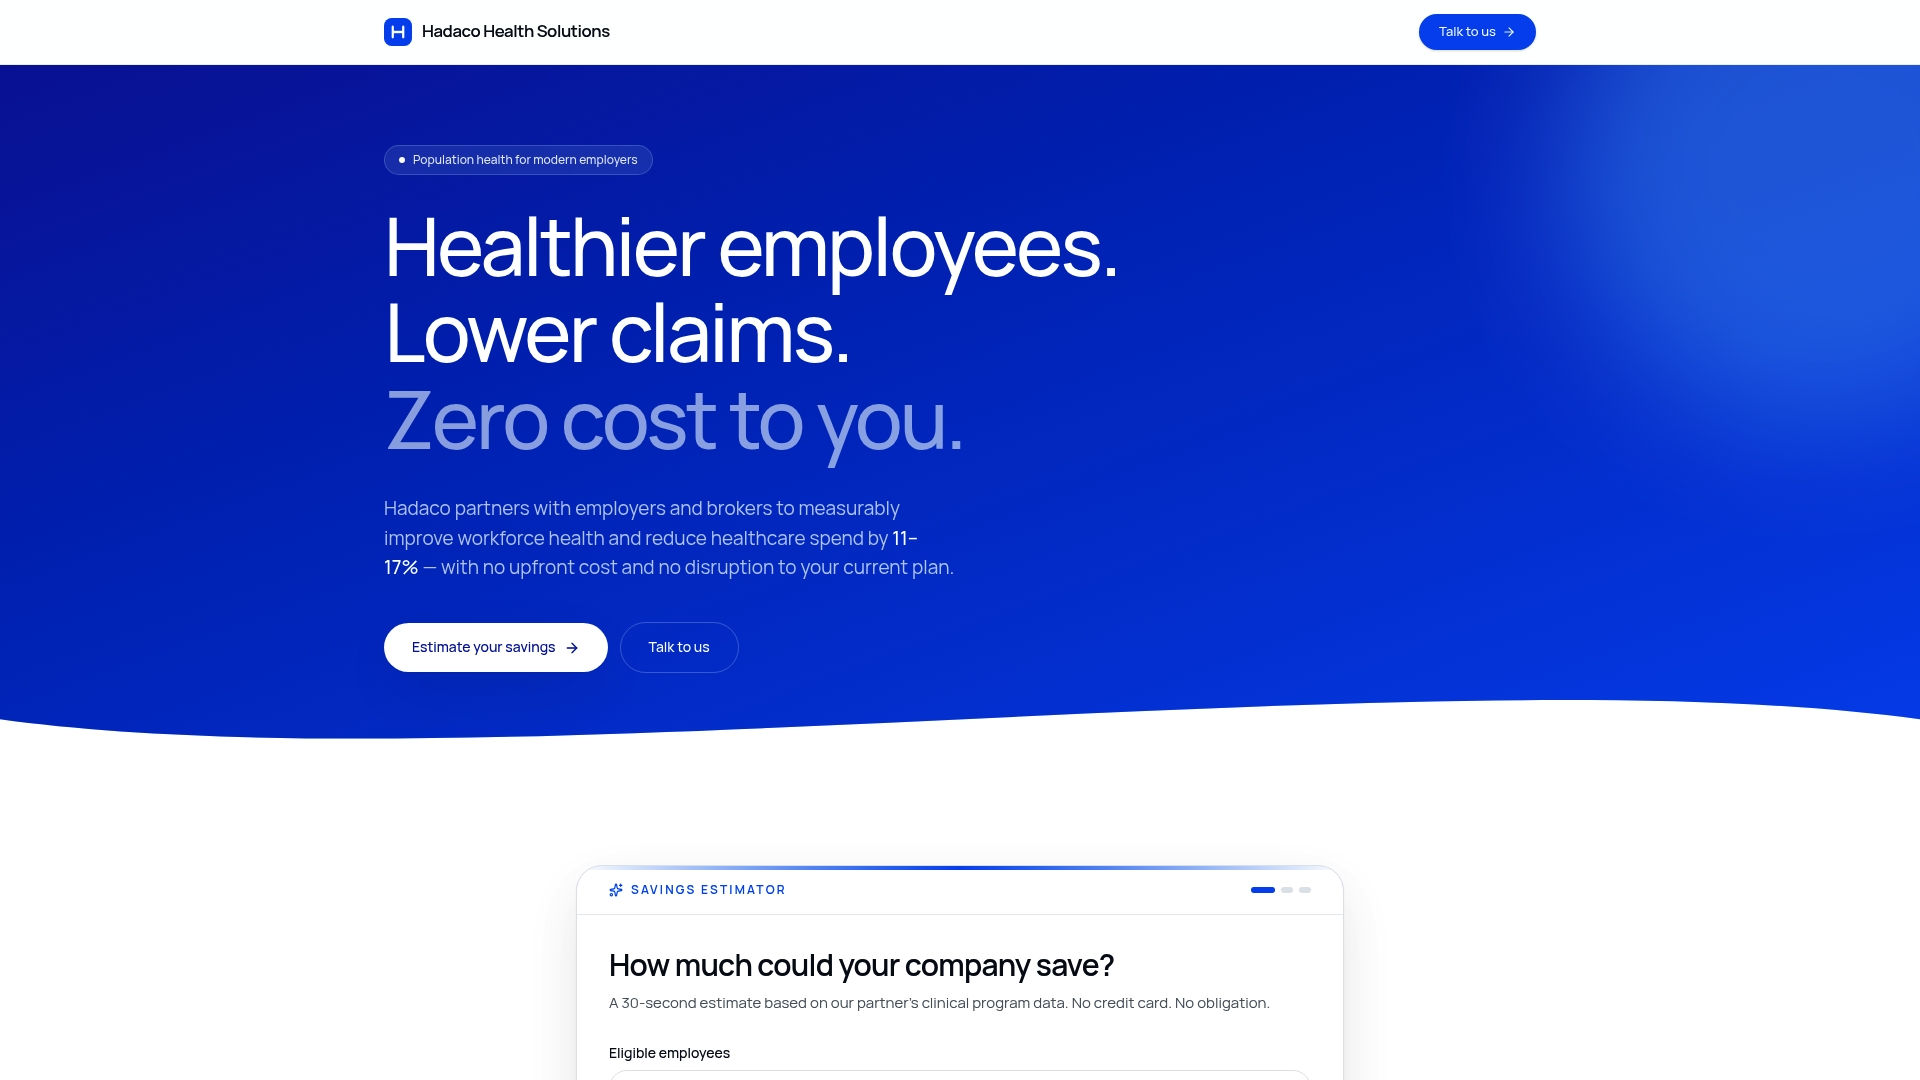
Estimators can offer transparent projections before employers commit, and quarterly reporting may show whether the program delivers on that projection. Programs often aim to complement existing benefits rather than replace them, addressing chronic disease, preventive care, and engagement together.
If you want a projection built on your own headcount, claims history, and participation goals, start with a consultation at Hadaco and see what your specific range looks like.
Sources
- The impact of enhanced behavioral health services on total healthcare costs among US employers: a site-level analysis of 19 cohort studies - PMC
- Impacts of Workplace Health Promotion and Wellness (CDC study supplement)
FAQ
How do I estimate wellness savings for my company?
Combine your baseline medical spend, expected percent reduction, and productivity gains from reduced absenteeism into a single formula, then subtract program cost to get net savings. Use a low, likely, and high scenario rather than one number, since pooled research shows outcomes vary widely by population and design.
What is a realistic ROI for a workplace wellness program?
Published models range from roughly $2.03 to $2.53 per dollar invested when combining medical and productivity savings, with some behavioral-health-focused programs reporting higher multiples. Higher-risk populations and more comprehensive programs tend to land at the top of that range.
How long does it take to see measurable wellness savings?
Measurable financial and clinical outcomes typically take 18 to 36 months to appear, based on randomized trial evidence, while some productivity improvements can show up sooner. Expecting savings within the first six months usually leads to disappointment and a premature judgment of the program.
What does Hadaco's savings estimator show employers?
Hadaco's estimator gives employers a transparent, upfront projection of expected savings based on their own workforce data, with no upfront fees required to start. The company reports that clients often see an average of $451 per employee in savings during the first year, tracked through quarterly outcome reporting.
What is a good financial wellness score for employees?
Financial wellness scores vary by the specific tool or survey used, so there is no single universal benchmark. Employers typically track improvement over time within their own population rather than comparing against an external standard.