
The fastest, evidence-backed way to reduce total cost of care is to cut avoidable utilization, not chase deeper unit-price discounts. That means coordinated primary and chronic care, tighter navigation and site-of-care steering, behavioral-health integration, and medication optimization, layered on top of your existing plan. None of it counts as savings until you measure against a pre-specified baseline with risk adjustment and a net-savings accounting that includes fees.
TL;DR:
- Significant savings require focusing on reducing avoidable utilization, such as hospital admissions and ED visits, rather than solely negotiating unit prices.
- Evidence suggests that care coordination, behavioral health integration, medication optimization, and targeted social-needs support deliver the most reliable cost reductions.
- Accurate measurement relies on claims data from at least 12 months, matched control groups, and pre-specified savings metrics evaluated over 12 to 24 months.
- Most cost reduction programs need a staged timeline of 12 to 24 months before measurable results become clear and sustainable.
Table of Contents
- What Drives Total Cost of Care Reduction: Utilization vs. Price
- What Actually Reduces Total Cost of Care: Six Levers That Work
- How Do You Measure Net Savings Accurately?
- What's a Realistic Timeline for Reducing Healthcare Costs?
- Does Total Cost of Care Reduction Actually Work? The Evidence
- Why Some Cost Reduction Programs Fail
- How Hadaco Applies This Evidence-Based Approach
- What Benefits Leaders Should Do This Quarter
- Ready to Pilot a Measurable Cost Reduction Program?
- Sources
- FAQ
What Drives Total Cost of Care Reduction: Utilization vs. Price
Total healthcare expenditure breaks into two levers: how often people use care (utilization) and what each unit of care costs (price). Most employer strategies chase price, negotiating steeper discounts with hospitals or switching pharmacy benefit managers. That's the smaller lever.
Utilization also hides a trap: substitution. Push care out of hospitals and it often reappears somewhere else, at a different price point, under a different budget line. Reducing admissions is only real savings if the total across every category, hospital, outpatient, pharmacy, and specialty, nets out lower than where you started.

Maryland's Total Cost of Care Model shows this pattern clearly. The state cut hospital admissions by 16.2% in its early years while non-hospital spending crept up in some categories. The Maryland TCOC progress report still credits the model with roughly $689 million in net Medicare savings over its first three years, because the hospital-side reduction outweighed the offsetting increases.
Three things explain why Maryland's model held together where others haven't:
- Global budgets gave hospitals a financial reason to prevent admissions rather than fill beds.
- Every claim category got reconciled against the same baseline, so gains in one area couldn't hide losses in another.
- The evaluation ran long enough (three years) to separate real trend from noise.
That's the template worth copying for any employer program: incentive alignment plus full-category reconciliation.
What Actually Reduces Total Cost of Care: Six Levers That Work
Reducing medical expenses at the population level comes down to a short list of interventions with real evidence behind them, not a long menu of wellness perks. Here's the order of priority, from most reliable to more situational.
- Coordinated primary and chronic care. Embedding care managers directly inside physician practices, rather than running them from a health plan call center, produced measurably larger savings in AHRQ's analysis of care management programs. Close care gaps, extend same-week access, and let the primary care team own the relationship.
- Avoidable admission and readmission prevention. Transitional care after discharge, a phone call or visit within 48 hours, and a documented follow-up plan cut the odds of a bounce-back hospitalization.
- Behavioral-health integration. Untreated anxiety, depression, and insomnia drive downstream medical spend. A matched-control study on digital cognitive behavioral therapy for insomnia (SleepioRx) found $2,083 in mean first-year total healthcare cost savings per person, a 42% relative reduction, versus standard care.
- Medication optimization. Adherence support, formulary review, and pharmacist-led interventions lower both pharmacy and downstream medical spend simultaneously.
- Navigation and site-of-care steering. Diverting non-emergent ER visits toward urgent care, and steering elective procedures toward ambulatory surgical centers, moves the same service to a cheaper setting.
- Social-needs support for vulnerable cohorts. Food insecurity, housing instability, and transportation gaps drive avoidable ED use in high-risk populations.
That cohort typically drives more than half of total spend, so a navigation or care-management intervention aimed there pays back faster than any plan-wide wellness rollout.*
How Do You Measure Net Savings Accurately?
Cost-effective care strategies fail at the finish line more often than at the start, because leaders skip the measurement design and try to back into savings after the fact. AHRQ's guidance is blunt about this: not every member with a chronic condition needs care management, and program structure changes results as much as the intervention itself. Segment before you spend.
Set these up before launch, not after:
- A claims baseline covering at least 12 months, segmented by condition, site of care, provider, pharmacy, and avoidable utilization.
- A comparison group, matched or risk-adjusted, so you're not just comparing this year to last year in a vacuum.
- Predefined gross savings, vendor fees, net savings, engagement rate, quality measures, and equity measures, written down before results come in.
- Leading indicators (outreach, activation, care-plan completion, medication adherence) tracked separately from lagging indicators (risk-adjusted PMPM, admissions, ED visits, avoidable readmissions, pharmacy spend).
Difference-in-differences or matched-control designs are the standard for this kind of evaluation, and you typically need 12 to 24 months of claims runout before the numbers stabilize enough to trust.
What's a Realistic Timeline for Reducing Healthcare Costs?
Expect a staged 12 to 24 month cycle, not a quarter-over-quarter fix. Payment and delivery reforms consistently take longer to show up in claims than stakeholders expect, according to Health Affairs' review of shared-savings evidence.
- Months 0 to 3: Pull the claims baseline, segment the population, and identify your pilot cohort.
- Months 3 to 6: Launch outreach, sign data-sharing agreements, and confirm EHR or workflow integration with participating providers.
- Months 6 to 12: Run an early review of activation and care-plan completion. Adjust outreach or targeting based on what's working.
- Months 12 to 24: Complete the claims-based evaluation and reconcile gross savings against fees for a net-savings figure.
Report leading indicators to leadership quarterly and save the claims verdict for the 12 to 24 month mark. Anything sooner is a progress update, not a result.
Does Total Cost of Care Reduction Actually Work? The Evidence
The strongest studies share one trait: they target a specific population instead of a general one. Maryland's model, discussed above, delivered its net savings through hospital-side reductions tied to global budget incentives.
CMS's Accountable Health Communities model tells a similar story from the Medicaid and fee-for-service Medicare side. Screening for social needs, housing, food, transportation, utilities, and connecting members to navigators generated more than $200 million in net savings and measurably reduced inpatient and ED use for the targeted groups, per CMS's final AHC evaluation.
More than $200 million in net savings came from a model built almost entirely around navigation and social-needs screening, not clinical treatment.
A broader Health Affairs meta-analysis of CMMI-funded innovations found mixed results overall, but a consistent pattern within that noise: programs using health IT or community health workers, and those targeting clinically fragile patients, produced larger savings than generic, population-wide efforts.
- Maryland TCOC: hospital-driven reduction, global budgets as the incentive engine.
- CMS AHC: navigation and social-needs screening, targeted Medicaid/FFS cohorts.
- Health Affairs meta-analysis: HIT and community health workers outperform generic delivery tweaks.
- SleepioRx (JHEOR): a single clinical intervention, applied narrowly, produced a 42% relative cost reduction.
Why Some Cost Reduction Programs Fail
Randomized workplace-wellness trials have repeatedly shown improved health behaviors with no measurable drop in claims spend, a gap documented in trial data on PubMed. Disease-management programs aimed at people who already have a diagnosed condition perform far better, which tells you the problem isn't wellness itself. It's targeting a whole population when only a fraction of it drives the spend.
Three other failure patterns show up again and again:
- Savings shift between claim categories instead of disappearing, and vendor fees quietly eat the remainder if nobody nets them out.
- Low provider adoption or a workflow the care team never actually uses kills an otherwise sound program before it starts.
- Small pilot cohorts and short follow-up windows produce numbers too noisy to defend to a CFO.
Write contract KPIs around net savings after fees, not gross engagement, and you avoid most of this.
How Hadaco Applies This Evidence-Based Approach
Hadaco layers chronic-disease management, prevention, and engagement programs onto an employer's existing benefit plan without replacing it. Companies working with Hadaco have seen average first-year savings of $451 per employee, tracked through a transparent savings estimator and quarterly reporting rather than a one-time projection.
The measurement discipline matters as much as the program itself: a baseline, a segmented population, leading and lagging indicators, and a claims-based reconciliation at the end. That's the same structure behind every credible evaluation in this article.
What Benefits Leaders Should Do This Quarter
Start with three moves: pull a claims baseline now, identify your highest-risk cohort, and write down your success metrics before you sign a vendor contract. Present the pilot to finance with a 12 to 24 month horizon, not a promise of quarter-one results. If net savings after fees don't clear your hurdle by the claims-evaluation mark, pause, retarget the cohort, and retool rather than scaling a program that isn't reconciling.
— Gene
Ready to Pilot a Measurable Cost Reduction Program?
The model is built around the same principle this whole playbook rests on: coordinate chronic and preventive care around your existing plan, measure against a real baseline, and report net numbers every quarter instead of a single rosy projection at renewal. There is no upfront fee to start, and no disruption to the plan design your employees already know.
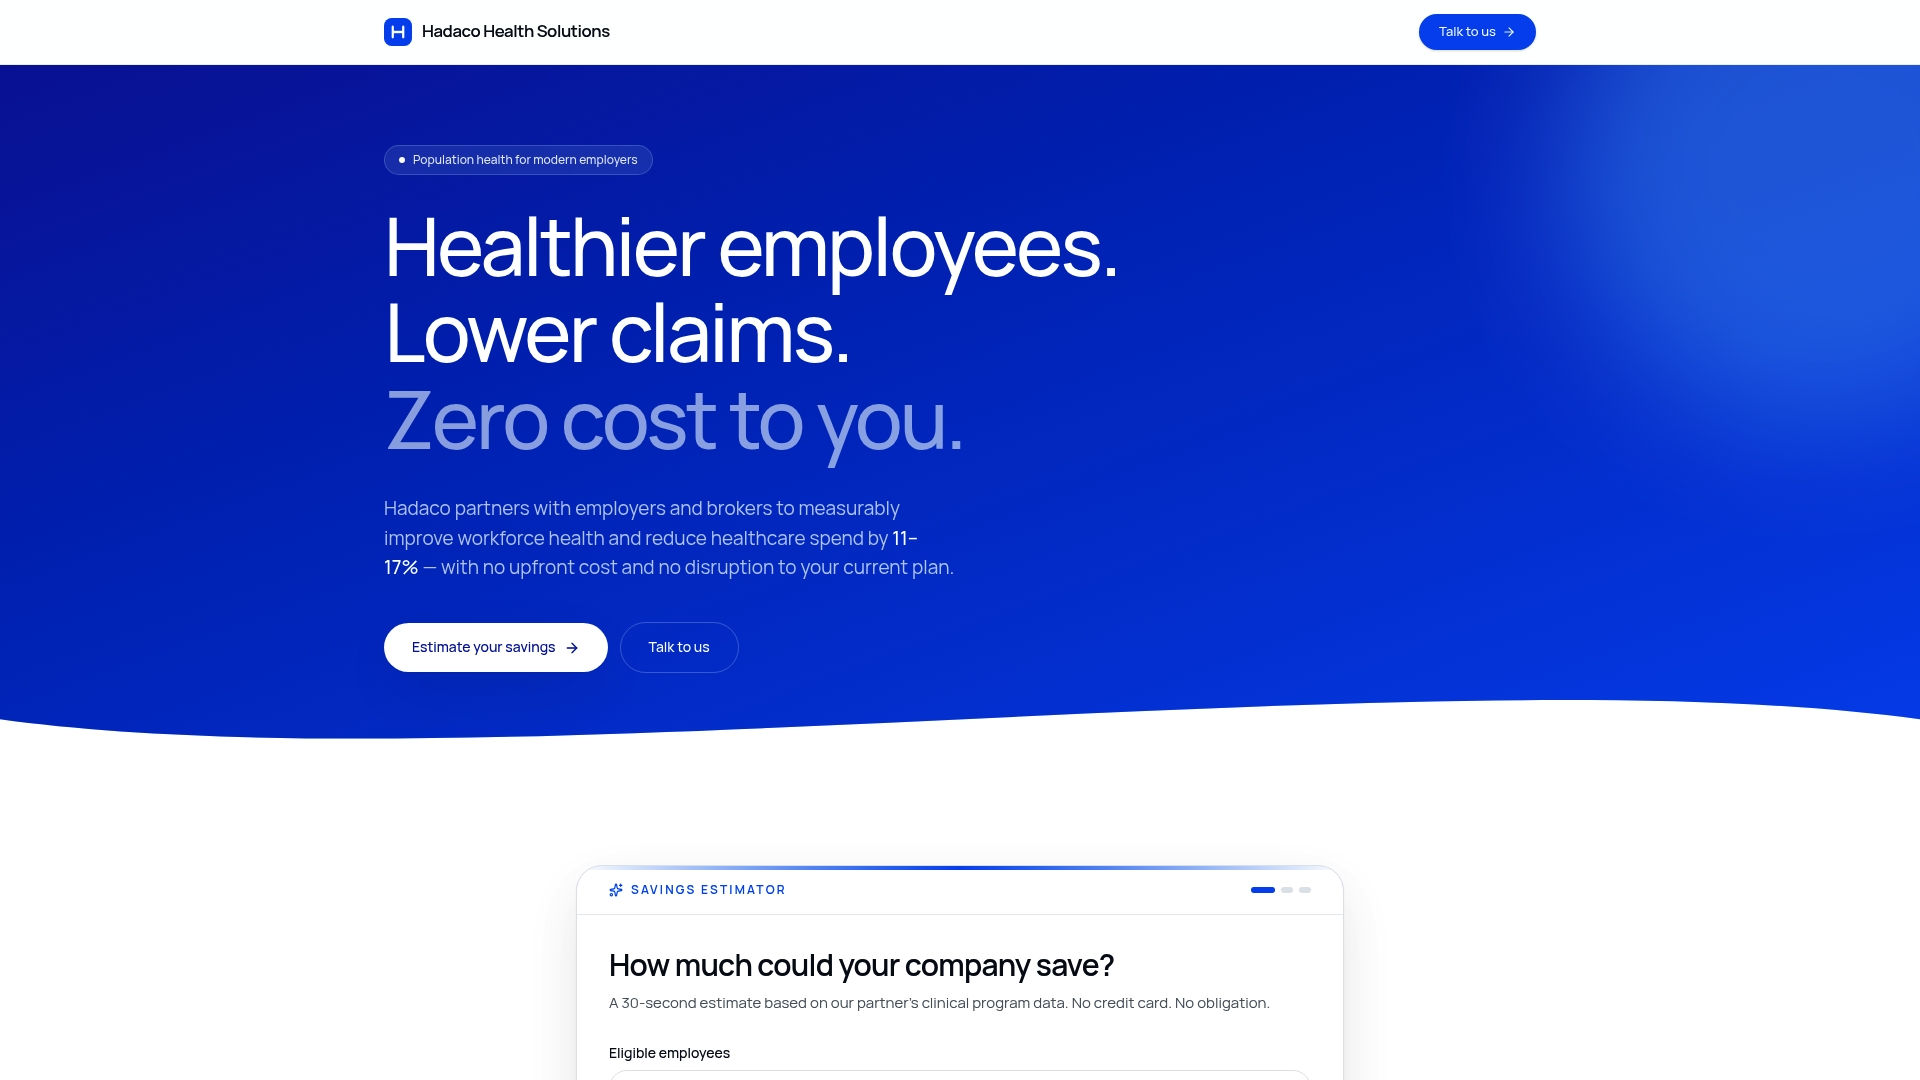
Before you book a call, pull together your last 12 months of claims data, your current plan structure, and a rough headcount by risk tier if you have one. Run your numbers through the savings estimator to see a projected range, then request a consultation to map a pilot cohort and a realistic evaluation timeline against your own healthcare spend data.
Sources
- Methods and Outcomes of Care Management Programs | Agency for Healthcare Research and Quality
- Evaluation of the Maryland Total Cost of Care Model: Progress report (CMS/Mathematica)
- Cost Savings Associated With Fully Automated Digital CBT-I: JHEOR
FAQ
Is $500 a Month Normal for Health Insurance?
Premium costs vary widely by plan type, region, and group size, so there's no single "normal" figure that applies across employers. What matters more for total cost of care is the claims spend behind the premium: utilization patterns, chronic disease burden, and avoidable admissions typically explain more of the cost trend than the premium number alone.
What Is the Total Cost of Care in Maryland?
Maryland's Total Cost of Care Model is a statewide Medicare payment approach that caps hospital budgets and ties them to population health outcomes rather than volume. The model generated an estimated $689 million in net Medicare savings over its first three years, driven mainly by a 16.2% drop in hospital admissions.
Are Policymakers Trying to Lower Healthcare Costs?
Federal agencies including CMS have run multiple demonstration models, including the Accountable Health Communities model and Maryland's Total Cost of Care Model, specifically designed to test whether care coordination and social-needs navigation can lower total healthcare expenditure. The CMS AHC model alone produced more than $200 million in documented net savings.
What Is a Total Cost of Care Model?
A total cost of care model measures and manages the full spend on a population, hospital, outpatient, pharmacy, and specialty combined, rather than negotiating discounts on individual services one at a time. Employers can apply the same logic at a smaller scale: Hadaco, for instance, layers chronic-care coordination and prevention programs onto an existing benefit plan and reports net savings quarterly against a claims baseline.
How Long Does It Take to See Total Cost of Care Reduction Results?
Most credible evaluations need 12 to 24 months of claims data to separate a real trend from normal year-to-year noise. Expect leading indicators like activation and care-plan completion within the first six months, with claims-based, risk-adjusted savings figures only reliable at the 12 to 24 month mark.