
The average U.S. employer-sponsored plan costs $9,804 a year for single coverage and $28,303 for family coverage in 2026, according to the KFF 2026 Employer Health Benefits Survey. Your own number will differ, and the number that matters most is your claims cost per member, because that is the part you can change. This guide gives the benchmarks, the drivers behind them, a way to calculate your own figure, and where employers find savings without rebuilding the plan. Hadaco's population health programs are built for that last step: they work alongside your existing benefits and carry no upfront fees.
TL;DR
- KFF puts 2026 average annual premiums at $9,804 for single coverage and $28,303 for family coverage.
- Employers surveyed by Business Group on Health project a median 9% cost increase for 2026, which plan-design changes could bring down to 7.6%.
- Chronic and high-cost conditions, GLP-1 drugs and pharmacy inflation are the main drivers.
- Shifting cost to employees is the most common response, and it has limits. Targeting the conditions behind claims is the alternative.
- Calculate your own cost per employee from total plan spend, not from a national average.
Table of Contents
- What employers pay per employee in 2026
- How much will costs rise in 2026?
- What is driving the increase
- How employers are responding, and what each response costs
- How to calculate your own cost per employee
- Where savings come from without a plan overhaul
- Our perspective
- Put your per-employee number to work
- FAQ
- Sources
What employers pay per employee in 2026
The most cited benchmark is the KFF survey, which tracks premiums for employer-sponsored coverage and who pays them. The 2026 figures:
| Coverage type | Average annual premium | Worker contribution | Worker share of premium |
|---|---|---|---|
| Single | $9,804 | $1,672 | 18% |
| Family | $28,303 | $7,471 | 27% |
Source: KFF, 2026 Employer Health Benefits Survey.
Subtract the worker contribution and the employer's share works out to roughly $8,132 a year for single coverage and $20,832 for family coverage. That is our arithmetic from KFF's published figures, not a figure KFF states. Per employee, the real cost depends on how many of your people take single versus family coverage, so a blended average sits somewhere between the two.
Size matters too. KFF found that workers at small firms contributed $9,687 a year toward family coverage in 2026, compared with $6,840 at large firms. Family contribution rates were 37% at smaller firms and 25% at larger ones. Larger employers generally carry more of the premium, which puts more of the cost on the employer's own budget.
What the premium figure includes and leaves out
Premium is the headline, but it is not the full cost of employing someone with coverage. A complete per-employee figure usually adds:
- Employer share of premiums, or for self-funded plans, paid claims plus administrative fees.
- Stop-loss insurance premiums, if you self-fund.
- Pharmacy benefit costs, where these are billed separately.
- Wellness, mental health, navigation and other program fees.
- Broker or consultant compensation.
When two benchmarks disagree, check which of these items each one counts. Some published figures are premiums only. Others are total plan spend divided by enrollment.
How much will costs rise in 2026?
The projections point the same direction. In its 2025 survey of 121 employers covering 11.6 million people, Business Group on Health found a median projected cost increase of 9% for 2026. Employers expected plan-design changes to reduce that to 7.6%.
A worked example makes the stakes concrete. Take a 500-employee company whose average employer cost is the single-coverage employer share above, about $8,132 per person. At a 9% increase, that is about $732 more per employee, or roughly $366,000 more across the workforce in one year. At 7.6%, it is about $618 per employee, or roughly $309,000. These are illustrations using the figures above, not forecasts for any specific company.

The lesson is that the trend compounds. A 9% increase this year becomes the base for next year's increase, which is why the cost per employee deserves attention before renewal, not after it.
What is driving the increase
Business Group on Health names cancer, musculoskeletal conditions, cardiac conditions, diabetes and mental health as leading cost drivers. It also points to two pharmacy pressures:
- GLP-1 use. 79% of employers it surveyed saw higher GLP-1 use, and another 15% expected it to rise.
- Pharmacy inflation. The survey forecast pharmacy cost growth of 11% to 12% heading into 2026.
These drivers share a feature. Most of them are chronic or long-running conditions, where a small number of members account for a large share of claims. That is why a population health approach starts with claims data and a short list of conditions, not with a generic benefits refresh. Our guide on managing high-cost claimants covers how HR teams can start, and our piece on workplace chronic disease costs goes deeper on the conditions above.
How employers are responding, and what each response costs
KFF reports what large firms did in response to projected cost increases:
- 44% increased the employee share of premiums.
- 21% increased deductibles or other broad cost sharing.
- 16% changed insurers or administrators.
- 10% added utilization-management requirements.
Each move has a price beyond the savings line. When the employee share rises, take-home pay falls, and KFF notes that higher worker contributions could raise affordability concerns. Employees who feel the squeeze are harder to retain. Changing carriers resets provider networks and can disrupt care in the middle of treatment. Utilization management adds administrative steps for members and staff.
These levers all move who pays. None of them lowers the underlying claims. That is the case for a second track alongside plan design: reduce the claims themselves by supporting members with chronic conditions, closing preventive care gaps and keeping people engaged with the benefits you already pay for.

How to calculate your own cost per employee
National averages help you judge whether you are in range. Your decisions should rest on your own number. Here is a routine finance and HR can run in an afternoon.
- Pull twelve months of plan costs. For a fully insured plan, use employer premium payments. For a self-funded plan, use paid medical and pharmacy claims, administrative fees and stop-loss premiums.
- Add program and vendor fees. Include navigation, mental health, wellness and any other benefit with a separate invoice.
- Divide by average enrolled employees. Use the average headcount over the period, not a single month, so seasonal hiring does not distort the result.
- Split by coverage tier. Report single and family separately so you can compare each with the KFF figures above.
- Find the concentration. List the share of spend from your top 1% and top 5% of claimants, and the conditions behind them. This is where intervention pays off.
- Apply the trend. Multiply by 1.09 for the Business Group on Health median projection, and by 1.076 for the plan-design scenario, to see a range for next year.
Step 5 is the one most teams skip, and it is the most useful. Our walkthrough on finance-ready cost containment shows how to present it to a CFO. If you work with a benefits advisor, the same data is what they need to benchmark you properly.
Where savings come from without a plan overhaul
One area stands out in the research. The 2026 MIT Sloan Health Systems Innovation Lab evidence review reports more promising results for chronic-disease management programs. That fits the cost drivers above: diabetes, cardiac and musculoskeletal conditions are where structured support meets the biggest claims.
A program aimed at those conditions has three jobs:
- Identify the right members from claims and risk data, so outreach goes where cost is concentrated.
- Support them between visits with evidence-based interventions for chronic disease, preventive care and mental health.
- Measure the result against claims on a fixed schedule, so finance can see what moved.
Measurement is what separates a savings program from a perk. Our guide to proving quarterly savings with claims data lays out how to build that reporting, and our overview of evidence-based wellness programs explains what to look for in program design. For the broader picture of what benefits leaders should plan for, see employer healthcare trends for 2026.
A savings benchmark to plan against
Hadaco reports that in their first year, companies often see average savings of $451 per employee, along with improved engagement and retention. Against the 500-employee example above, that average would equal about $225,500. Your result depends on your population and claims mix, which is why we start with an estimate built on your own data. The self-funded employer wellness guide shows how that works for self-funded plans.
Our perspective
Most conversations about healthcare cost per employee end at the renewal letter. The number arrives, the carrier explains it, and the employer chooses between higher contributions and higher deductibles.
We think the better question comes earlier: which members and which conditions are producing the claims, and what would it take to support them sooner? Chronic disease, preventive care, mental health and engagement all feed the same cost line, so we treat them as one program instead of four vendors.
Our approach complements the plans you already have. We do not ask you to replace your carrier or your benefit design. We offer a savings estimator so you can see the opportunity before you commit, and quarterly reporting so you can see the outcome after. Programs come with no upfront fees, and our fees depend on demonstrated savings and engagement outcomes, which keeps us accountable to the same number your CFO watches.
A culture of well-being is not a poster in the break room. It is employees who use their benefits, manage their conditions and stay with the company because of it.
Gene
Put your per-employee number to work
If your calculation shows concentrated spend in chronic conditions, the next step is sizing the opportunity. Hadaco's population health program is designed for employers and the advisors who serve them. It integrates with your current benefit plans without disruption, includes a cost savings estimator and quarterly outcome reporting, and comes with no upfront fees.
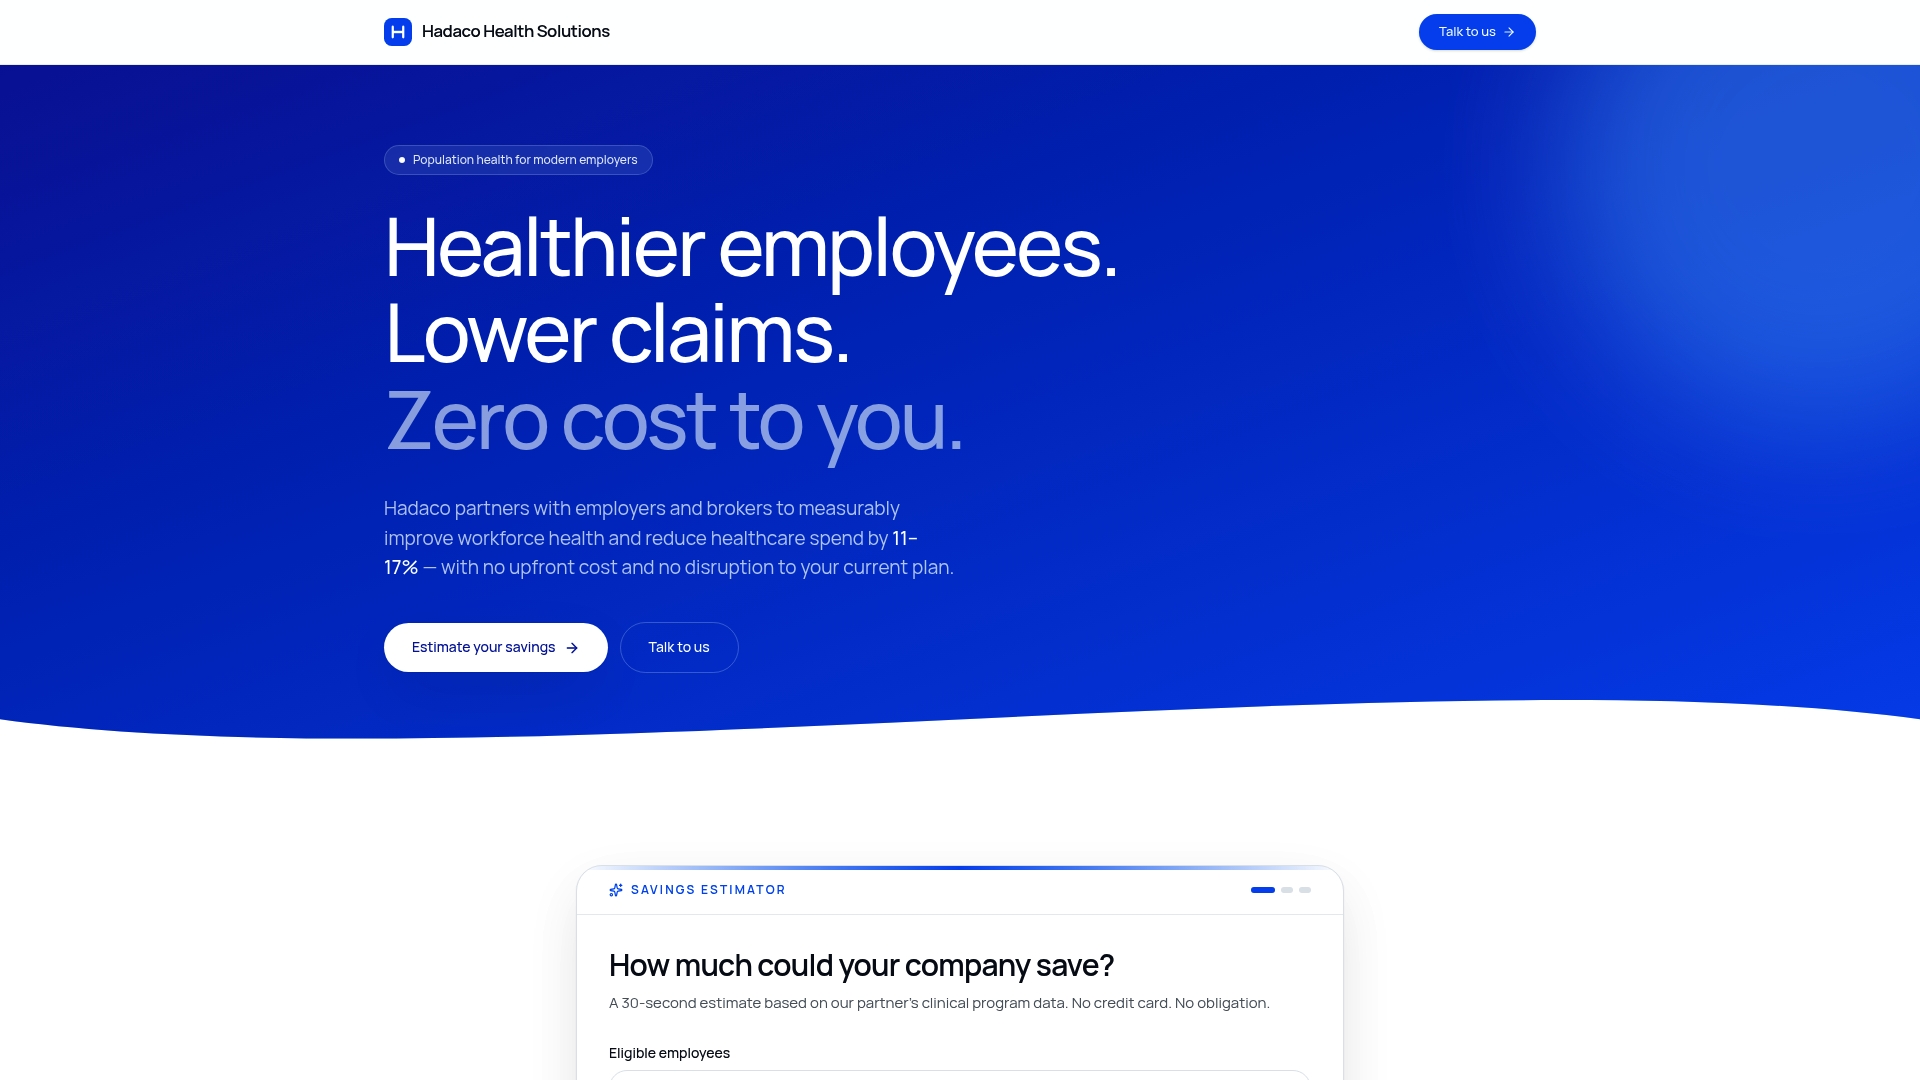
Bring your cost-per-employee figure and your top condition categories to a consultation, and we will work from there.
FAQ
What is the average healthcare cost per employee in 2026?
KFF reports average annual premiums of $9,804 for single coverage and $28,303 for family coverage in 2026. Workers contribute 18% of single premiums and 27% of family premiums on average. Your own figure depends on your coverage mix, plan funding and claims experience.
How much are employer healthcare costs expected to rise in 2026?
Business Group on Health's survey of 121 employers found a median projected increase of 9% for 2026. Employers expected plan-design changes to bring that to 7.6%. The firms surveyed cited chronic conditions, GLP-1 use and pharmacy inflation as the main pressures.
Why is the employer share different from the premium?
The premium is split between employer and employee. In KFF's 2026 data, workers pay 18% of the average single premium and 27% of the family premium. Smaller firms ask workers to contribute a larger share of family coverage than larger firms do.
How can an employer lower healthcare cost per employee without cutting benefits?
Start by finding which conditions and members drive your claims. Then add programs that support chronic disease management, preventive care and mental health on top of your current plan. Hadaco's programs work this way, with a savings estimator up front and quarterly reporting afterward.
Sources
- KFF, 2026 Employer Health Benefits Survey
- Business Group on Health, 2026 employer health care strategy survey
- MIT Sloan Health Systems Innovation Lab, corporate wellness evidence review